What a 'Balanced' Housing Market Actually Measures
The buyer's-or-seller's label comes from months of supply, which measures how quickly today's listings would sell, not prices. Through August 2026, Boulder, Longmont and Loveland all tightened on supply and none of their year-to-date medians rose. Read speed off supply and price off the solds.
Buyer's market, seller's market, balanced: the label is a measure of speed. It comes from months of supply: the homes listed today, divided by how many went under contract in an average month over the past year. The result is how many months the current shelf would take to sell at the recent pace. No sale price goes into it.
Yet it's the word buyers and sellers reach for when they decide what to ask or pay. In the year to August 2026, speed and price came apart across this corridor, and the word in the middle of the scale, balanced, told a buyer or a seller the least.
What does a balanced housing market mean?
A balanced housing market is one where the homes now listed would take a middling number of months to sell at the past year's pace. It is supply measured against pending sales, by the method ShowingTime describes. It tells you how fast homes are moving. On its own, it doesn't tell you whether prices are rising. In the year to August 2026 in Boulder, Longmont and Loveland, supply tightened while no year-to-date single-family median rose.
The calculation is ShowingTime's, and ShowingTime produces the town reports the Colorado Association of REALTORS publishes. Two inputs, listings and contracts, and neither is a price. The label is that one number, sorted into three bands. ShowingTime says a balanced market generally lies somewhere between four and six months of supply, with the market favoring sellers below four and buyers above six. Its own hedges, "generally" and "somewhere between," tell you the bands are a reading laid over the number, not something the number measures. The monthly Colorado Association of REALTORS report that ShowingTime also produces draws the line elsewhere: "A balanced market ranges from 4 to 7 months of supply."
So a buyer who hears "seller's market" and concludes prices are climbing, or a seller who hears it and decides there's room to ask more, has read something into the label that its arithmetic never measured.
Supply moved this year. The medians didn't.
In the August 2026 town reports, single-family supply tightened in Boulder, Longmont and Loveland alike. Boulder's fell from 5.4 months a year earlier to 4.2. Longmont went from 3.5 to 2.8 and Loveland from 3.9 to 3.0, which puts those two in one cluster near the seller's end of the scale.
Now the price of what sold, year to date through August against the same stretch of 2025. Boulder's median was $1,299,900 against $1,300,000. Longmont's was $610,000 against $625,000. Loveland's was $528,750 against $530,000. In none of those three towns did the median rise. (Berthoud, whose supply loosened from 4.2 months to 5.8, sells too few homes a month for a year-over-year median to mean much, so it's left out.)
A town median follows the mix of houses that closed, one of the ways a market figure misleads. A repeat-sales index, which prices each house against its own earlier sale or appraisal, is the check, and our corridor market pulse runs it: averaged over four quarters, the Federal Housing Finance Agency's two indexes for Boulder County read −0.24% and +0.77%, and Larimer County's one-year readings sit near +0.2% on both. On that full-year view, neither county's reading is more than about a percent from flat.
Speed itself split in Loveland: the shelf shortened while homes took longer to sell, 70 days year to date against 64. The Loveland report explains why.
That doesn't make supply and price unrelated. A Federal Reserve Bank of Richmond brief found that national months of supply for new homes moves ahead of national price growth, most strongly at about ten months, and on its own accounts for roughly a third of it. It's a real signal: slow, partial, national, and built on new-home supply.
Why balanced isn't halfway
The scale puts buyer's, balanced and seller's on one line, as if they were three settings of a single control. In ordinary speech, though, "seller's market" usually carries two meanings: homes go quickly, and prices climb. You can measure those separately. This year they disagreed.
In a piece about half-finished renovations we argued that a middle position only traps you when both ends are settings of one variable. Where the ends split on two things at once, a point between them is its own position. The market label is that second case drawn as though it were the first.
So balanced, on this scale, means a balanced shelf and nothing more. The corridor's real positions this year are combinations the one-line scale has no word for. Longmont and Loveland: a quick shelf and a price that didn't rise. Boulder: a middling shelf and a flat price. Advice written for the middle of the line (ease off on price, take your time) assumes the two readings move together. This year it's right about one reading at most, and which one depends on the town.
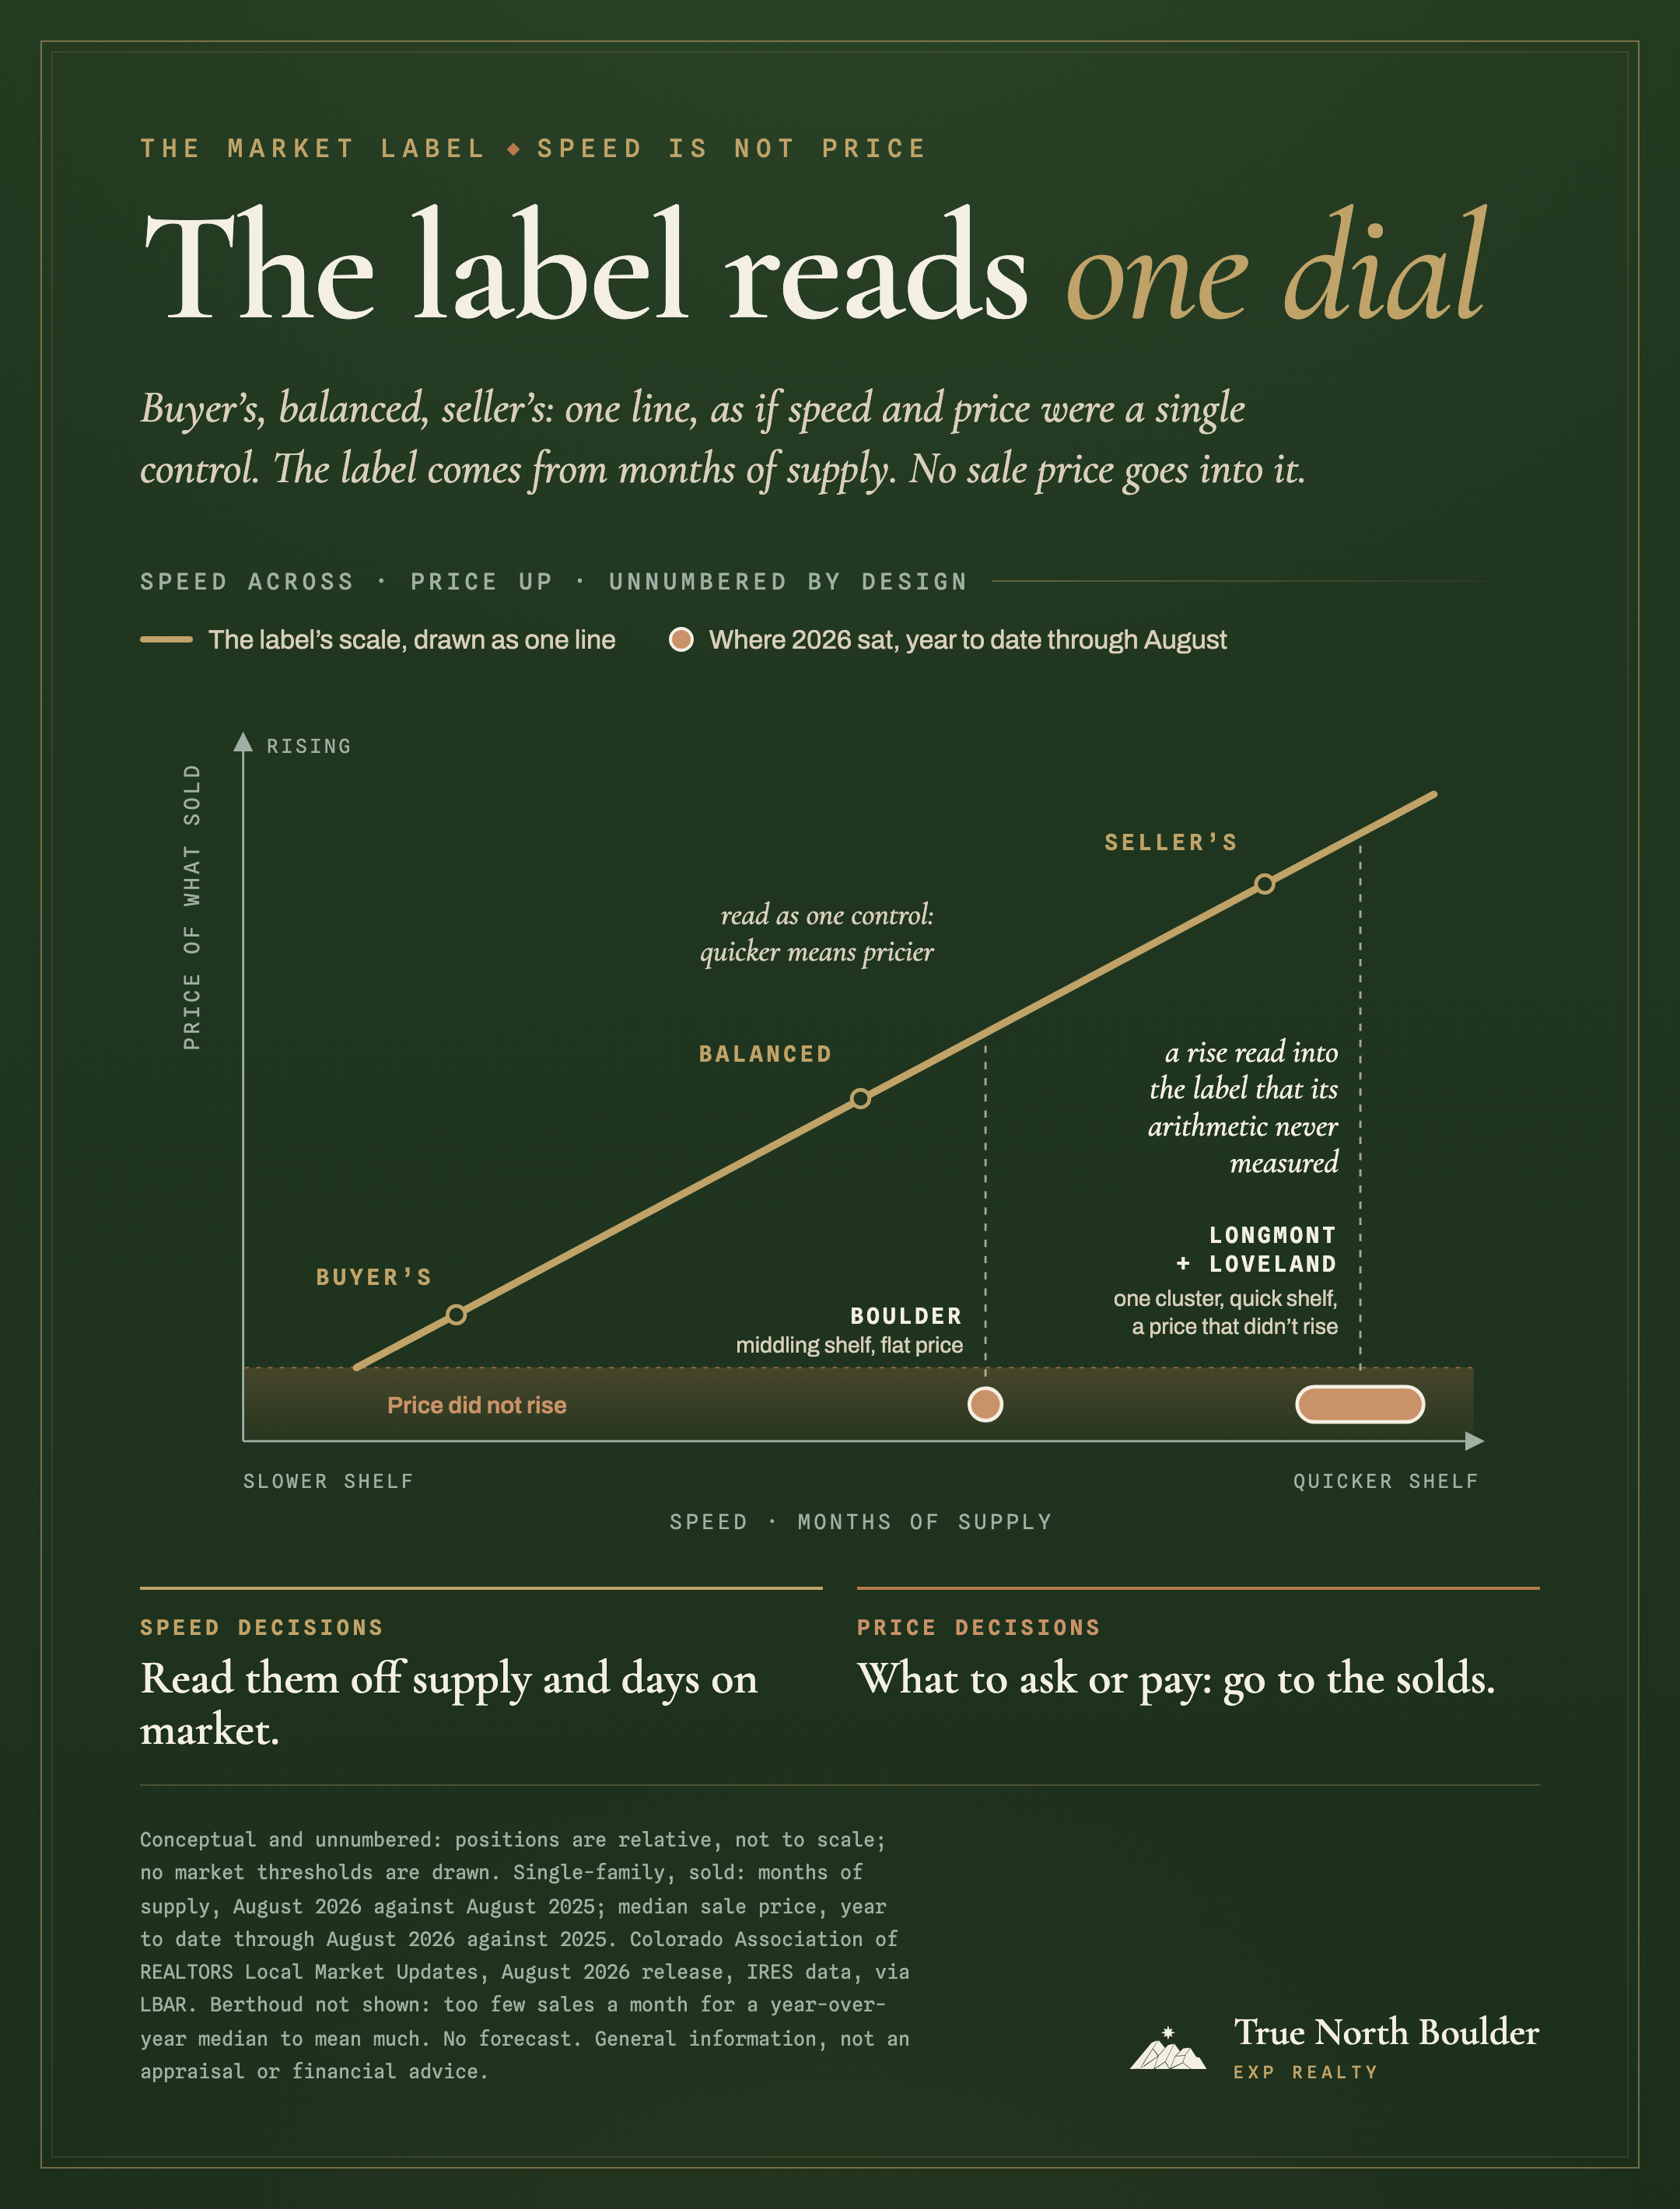
Speed decisions and price decisions
Sort the decision before you reach for the label. Each one turns on speed or on price, and the two are read off different numbers.
| Decision | Turns on | Read it off | Not off |
|---|---|---|---|
| How ready you need to be before you tour: underwriting done, a walk-away number set | Speed | Months of supply in your price range, not the town's, and year-to-date days on market | What the label seems to say about price |
| Whether an offer with a home-sale contingency can compete | Speed | Supply in your price range, how long that house has sat, and how quickly homes like yours are selling (contingent offers) | The town's label alone |
| How long your sale may take, and how long you might carry two homes | Speed | Year-to-date days on market where you're selling, plus about a month to close if the local count stops at the accepted offer; ask your agent which it is, since the reports don't say (fall or spring) | A headline about the region |
| Your list price | Price | Adjusted comparable sales | "It's a seller's market" |
| Your offer ceiling | Price | The solds an appraiser will read, plus any gap you'd cover in cash | How short the shelf is |
| Whether waiting changes what you pay | Price | A repeat-sales index over a full year (our corridor pulse carries the county readings), plus the rent and rate you'd carry meanwhile (renting while you wait) | The label, or anyone's forecast |
If you're buying where the shelf is short and the price is flat, be ready to move quickly; that's the speed reading doing its job. Just don't let the label set your number. An appraiser reads comparable sales, not supply. A bid stretched past them because "it's a seller's market" opens an appraisal gap, and the label won't have told you how you'd cover it.
If you're selling, a quick shelf brings showings. It doesn't move the sales your price will be judged against, and pricing above them on the strength of the label tends to cost weeks.
A slower shelf can give a buyer room, against the asking price and on terms like inspection, appraisal and possession. That's speed. It doesn't tell you comparable homes are selling for less, which would be price. And that room is mostly on homes that have already sat; a fresh listing priced at its comps can still draw several offers on a slow shelf.
Moving up means reading two shelves: the one you're selling into and the one you're buying into. A town's supply number blends every price range, so read each shelf at your own price. Then price each side off its own solds. The buy-before-you-sell playbook lays out which side goes first.
What we won't read off these numbers
No forecast. The supply-to-price relationship in the Richmond Fed brief is national and built on new-home supply. Run forward on one town's series, it would be a guess about next year's prices, so we don't publish one.
No figure for the $800K–$1.5M band. The reports here are town figures. The indexes are county ones, and they undercount homes in this band because they're built from loans or sale prices that federal loan limits cap. The move-up band trades above the Longmont and Loveland medians and straddles Boulder's, and none of the reports cited here breaks it out. An agent's MLS search filtered to your price range can count what's listed there and what went under contract over the past year, which gives months of supply at your price, and show how long those homes took to sell. That's a working read for your own decision, not a figure we publish.
No ranking between Longmont and Loveland. At 2.8 and 3.0 months they are one cluster, and which prints lower in a given month is a fact about the month.
No net price. The medians are of the sale price and, by the reports' own footnote, don't account for seller concessions such as a rate buydown or closing credit, so a flat median can sit over a softer net.
No appreciation rate from a town median. We compare medians only as levels and leave direction to the county repeat-sales indexes.
The bottom line
The buyer's-or-seller's label reads one thing: how fast the homes listed now would sell at the past year's pace. In the year to August 2026, in Boulder, Longmont and Loveland, that reading tightened while the price of what sold didn't rise. Use the label for decisions about speed. For what to ask or what to pay, go to the solds.
Frequently asked
What does a balanced housing market mean?+
It means the homes for sale right now would take a middling number of months to sell at the recent pace. The figure underneath is months of supply: current inventory divided by a rolling twelve months of pending sales, the method described by ShowingTime, which produces the Colorado Association of REALTORS town reports. So a balanced reading describes how fast homes are moving. It doesn't say whether prices are holding, rising or falling. For that you need the prices of what actually sold, and for direction, a repeat-sales index read over a full year. In the year to August 2026 in Boulder, Longmont and Loveland, supply tightened while no year-to-date single-family median rose.
Does low inventory mean home prices will rise?+
Not on any schedule you can plan around. Supply does carry some information about price: a Federal Reserve Bank of Richmond brief found that national months of supply for new homes runs ahead of national price growth, most strongly at about ten months, and on its own accounts for roughly a third of it. But in Boulder, Longmont and Loveland, supply tightened over the year to August 2026 and none of their year-to-date single-family medians rose. We don't run the national relationship forward on one town to forecast its prices.
Can a housing market tighten without prices rising?+
Yes. Boulder single-family went from 5.4 months of supply in August 2025 to 4.2 in August 2026, while its year-to-date median sale price through August was $1,299,900 against $1,300,000 a year earlier. Longmont and Loveland tightened too, and neither median rose; on a full-year view, the county repeat-sales indexes, the better read on direction, moved less than a percent either way. A shorter shelf says the homes listed would sell through sooner at the recent pace; it does not say they are selling for more. Our monthly Boulder market report carries the current figures.
Should I wait for a buyer's market before I buy?+
That is a price decision, and the label won't settle it. A buyer's market on this scale means more homes sitting longer, which can give you room against the asking price and on terms like inspection and possession. It doesn't promise that comparable homes will sell for less than they do now, and we don't forecast prices. If you'll rent in the meantime, count the rent as part of what waiting costs; it's spent whichever way prices go.
A move inside the corridor runs on two shelves and two sets of solds: the town you leave and the town you buy in. We'll lay out all four, each next to the decision it answers.
The neighborhood, the parcel and the insurance quote, which a town's market number doesn't capture, are in the town guides for Boulder and Loveland.
General information about market data, not an appraisal and not financial advice.
Daniel Hsieh is a licensed Colorado real estate broker with True North Boulder, brokered by eXp Realty.
Sources & data notes
- Months of supply method (current month's inventory divided by a rolling twelve-month calculation of pending sales): ShowingTime, “Everything You Need to Know About Months Supply of Inventory” (article dated August 30, 2017). ShowingTime produces the Colorado Association of REALTORS Local Market Updates. The same article gives the bands: “Generally, a balanced market will lie somewhere between four and six months of supply,” with figures under 4.0 and over 6.0 read as favoring sellers and buyers respectively.
- Town figures, single-family, sold, August 2026 release (current as of September 3, 2026): months of supply for August 2026 against August 2025; median sale price and days on market (average) year to date through August 2026 against the same stretch of 2025. Colorado Association of REALTORS Local Market Updates, data from IRES, republished by LBAR: Boulder · Longmont · Loveland · Berthoud. Each report covers the market it labels by town; the delineation behind each label is not stated in the report. The reports note that median and average sale prices do “not account for seller concessions and/or down payment assistance.”
- A second band, from the same producer: Colorado Association of REALTORS Monthly Indicators, Statewide, September 2026 (current as of October 5, 2026), glossary entry for Months Supply of Inventory: “A balanced market ranges from 4 to 7 months of supply.” CAR Monthly Indicators, Statewide. The glossary defines Days on Market Until Sale only as “A measure of how long it takes homes to sell, on average,” with no endpoint.
- Repeat-sales indexes: Federal Housing Finance Agency House Price Index, 2026Q2 release (August 25, 2026). Boulder MSA (Boulder County): four-quarter averages, 2025Q3–2026Q2 against 2024Q3–2025Q2, computed by us from FHFA index levels: all-transactions −0.24%, expanded-data +0.77%. Fort Collins-Loveland MSA (Larimer County): one-year change, all-transactions +0.22% (FHFA table), expanded-data seasonally adjusted +0.25% (computed by us). We read four-quarter averages for Boulder because the single latest quarter's one-year changes disagreed on sign (all-transactions −2.26%, expanded-data +2.31%), and FHFA notes that short-term differences between its indexes can be significant. Neither index fully counts the $800K–$1.5M band: the all-transactions index uses only Fannie Mae and Freddie Mac loans, which in Boulder County can’t exceed $879,750 (Larimer $832,750), and the expanded index adds FHA loans and county-recorder sales, but only below FHFA’s annual loan-limit ceiling.
- Supply as a lead on price: Federal Reserve Bank of Richmond, Economic Brief No. 25-11 (March 2025). National new-home months of supply against national Case-Shiller house price growth, through December 2024: the correlation is strongest at a ten-month lag (−0.60); projecting twelve months ahead, months of supply alone explains 34.7% of annual house price growth (36% at the ten-month lag).