Should You Sell in Fall or Wait for Spring in Boulder?
Spring pays a little more in Boulder, not the 16% you have read: the one study that compares like with like puts it in low single digits. And a move-up seller pays that lift again on the house they buy, so waiting widens the gap. Boulder's real seasonal effect is time, not price.
If you're selling a Boulder home this fall and not buying up in this market, whether you are leaving or trading down, spring is worth a little more, and you can afford to wait for it. If you're trading up inside the same market, waiting is likelier to cost you than pay you.
The same seasonal lift you collect on your sale gets charged to you again on the house you buy. The honest size of the prize is low single digits, not the 16% you've probably read. Here is the arithmetic.
Key takeaways
- The repeated “16% more in June” figure is published with no stated method. The one analysis that verifiably compares like with like puts the whole best-to-worst spread at 2.8 points, and a second, independent dataset lands at 1.7%.
- Boulder’s repeatable seasonal effect is time, not price: 48–68 average days on market in April–June against 72–111 in December–February, two years running.
- Winter brings about 37% fewer competing listings and about two-thirds fewer closings. Both sides thin; the buyer side thins close to twice as far.
- A seasonal premium is symmetric, so if you are buying up it lifts the bigger house too, and waiting widens the gap you have to fund.
The 16% you were promised comes with no method attached
The line repeated across this whole topic comes from NAR: homes are 16% more expensive in June than in December through February. Read the article and it names no data source and no method for that figure. The studies that do compare like with like put the seasonal price effect in low single digits: ATTOM's monthly premium runs 7.9% to 10.7%, but that is a premium every month carries over the home's modeled value, and only the 2.8-point spread between months is seasonal; Zillow's best listing window is 1.7%. For Boulder no seasonal premium is published at all; the nearest figure is Denver's 2.2%.
That number is doing enormous work, so be blunt about what it is. It comes from a 2024 National Association of Realtors seasonality post that states the figure and never says what it was computed from: no series named, no method described. The same article labels its time-on-market figure a median every time it reports one, season by season. For the price figure it gives no label at all.
That matters, because an unadjusted comparison of June prices to winter prices measures two things at once and cannot tell you which one moved. It measures what houses are worth, and it measures which houses happened to sell. Which houses sell changes with the season, and it does not change in one reliable direction. A number that cannot separate the two is not evidence of a price premium. It is evidence that the mix moved.
One analysis separates them properly, and a second, built from different data, lands in the same place:
| Where the number comes from | What it actually compares | Seasonal effect |
|---|---|---|
| NAR seasonality post (2024) | Not stated. No source or method given for the price figure. | 16% |
| ATTOM, 52 million sales 2015–2025 | Each sale against an automated valuation of that same home, by closing day | 2.8 points |
| Zillow, 2025 sales, 35 largest metros | Homes listed in the last two weeks of May against the rest of the year. Method not published in the release. | 1.7% |
ATTOM's premium peaks at 10.7% in March and bottoms at 7.9% in October, so the entire spread between the best month and the worst is 2.8 percentage points. Zillow put the best listing window at 1.7%, about $6,000 on a typical U.S. home. Different methods, different datasets, and both land in low single digits. That's the prize you would be waiting for.
The two are not measuring quite the same act, and the difference decides which one this page illustrates with. ATTOM's figures are keyed to the day a sale closes, not the day it lists, so they answer a slightly different question: a home listed in October closes in November or December, and one listed in April closes in May or June. Zillow's are keyed to the listing window, which is the decision actually in front of you. So where this page needs a rate to work with, it uses Zillow's, and it uses the nearest one published to us rather than the smallest: Denver, at 2.2%, for homes listed in the first two weeks of May. The national 1.7% in the table above is a different window, the last two weeks of May. Denver is a separate market from Boulder and we are not going to pretend otherwise, but it is the closest published figure to this corridor, and it is the larger of the two, which is the honest direction to err in when the whole argument here is that the prize is small.
Boulder's own numbers show why the unadjusted version misleads. In February 2025 the city's single-family median was $1,895,000 on 39 sales. In June 2025 it was $1,170,000 on 91 sales. February came in 62% higher than June, in the same year, in the exact opposite direction to the seasonal story. Boulder houses did not shed a third of their value between February and June. The mix of what sold changed, and a monthly median can't see the difference. So we will not argue seasonality from one, and neither should anyone selling you a listing date.
What Boulder's own calendar actually shows
Boulder’s seasonal signal shows up in the calendar, not the price tag. Single-family homes averaged 48 to 68 days from list to accepted offer in April through June, against 72 to 111 days in December through February, in both of the last two years.
Here is the series we would want if we were the ones deciding. Every figure is an average, and it measures the days from listing to an accepted offer, not to closing. It starts in November because that is where our source's published run starts: there is no August or September report on the index for that stretch, and the October batch is incomplete.
| Month | 2024–25 season | 2025–26 season |
|---|---|---|
| November | 88 | 73 |
| December | 94 | 86 |
| January | 95 | 111 |
| February | 91 | 72 |
| March | 69 | 79 |
| April | 68 | 48 |
| May | 64 | 60 |
| June | 54 | 68 |
| July | 75 | 87 |
Source: CAR Local Market Update, Boulder (IRES data), single-family sold listings; average days from list to accepted offer, by month.
Two independent years, the same shape. January is the slowest month both times, the fastest month falls in April through June both times, and every single December-through-February month in the series is slower than every single April-through-June month. The two windows do not overlap anywhere. The distance between the fastest and slowest months is about a month and a half of your life with the house on the market.
So the seasonal effect that is genuinely big in Boulder is time, and the one that is small is price. They're separate variables, and they don't have to move together, which is why the popular advice feels true and still gets the size of the prize wrong. Anyone who has watched a Boulder listing sit through February is describing something real. They're describing a calendar problem, not a valuation one. The August 2026 report, our current anchor and the most recent full vintage, has Boulder single-family at 72 days on market year to date and 4.2 months of supply against 5.4 a year earlier; the series above is labeled through July's 87, and August came in at 69. That is a balanced market that has been tightening, not a seller's market, which is precisely why a fall list price has to be right on the first attempt. The running figures live in the monthly Boulder market report.
One caveat covers every number on this page. These are town-level single-family figures, and the $800K–$1.5M move-up band sits below Boulder's median, in the more liquid tier, while the town aggregate is pulled around by luxury stock that sits for a year. Nobody publishes seasonality for the band, so treat the town pattern as direction, not as your listing's schedule.
Fewer competitors, and far fewer buyers
Both true and half a story. In Boulder in 2026, January carried 206 active single-family listings against 327 in June, about 37% fewer, and 39 closings against 112, about two-thirds fewer. Inventory thins in winter and demand thins about twice as far, which is exactly why homes sit longer.
The second thing you'll be told is that there's less competition in the off season. True, and it's the smaller half of the trade. In 2026, Boulder carried 206 active single-family listings in January and 327 in June. Over those same months, closings ran 39 in January and 112 in June.
Read the two together and the trade is plain: you lose about 37% of your competitors and roughly two-thirds of your buyers. That's the mechanism behind the days-on-market table above, and it's why a thinner field doesn't rescue a winter listing on its own. Run the sentence in the other direction before it comforts you: waiting for spring means waiting for the buyers and the competition together, from 206 active listings in January to 327 by June. You would be a better-attended listing in a much larger field.
There is a version of this that runs in your favor, and nobody writing on this topic seems to publish it. Boulder's months of supply was 3.5 in November 2024 and 3.8 in November 2025, against 6.2 and 4.5 the following Junes. On that measure the autumn market carries less standing supply than the spring market it is usually compared to. Read it precisely, though, because it is the same trap as the median: months of supply divides today's active listings by a sales rate averaged over the whole preceding year, so it registers the thinner board and not the thinner buyer pool. It is a fair description of your competition and a poor one of your demand.
The usual consolation is that winter buyers are more serious. We looked for something to support that and found industry assertion rather than research. A smaller pool may genuinely be more motivated. But more motivated is not something we could find anyone measuring, and two-thirds smaller is, so we are not going to hand you the first as compensation for the second.
One more number, pinned carefully. Percent of list price received is measured against the last asking price, after every reduction, and it excludes concessions. It can never register a price cut, and it counts only the homes that sold at all. Even on that flattering measure, January 2026 was the worst of the eight months reported so far in 2026, at 94.4%, against 98.8% in April.
If you are trading up, the spring premium is charged to you twice
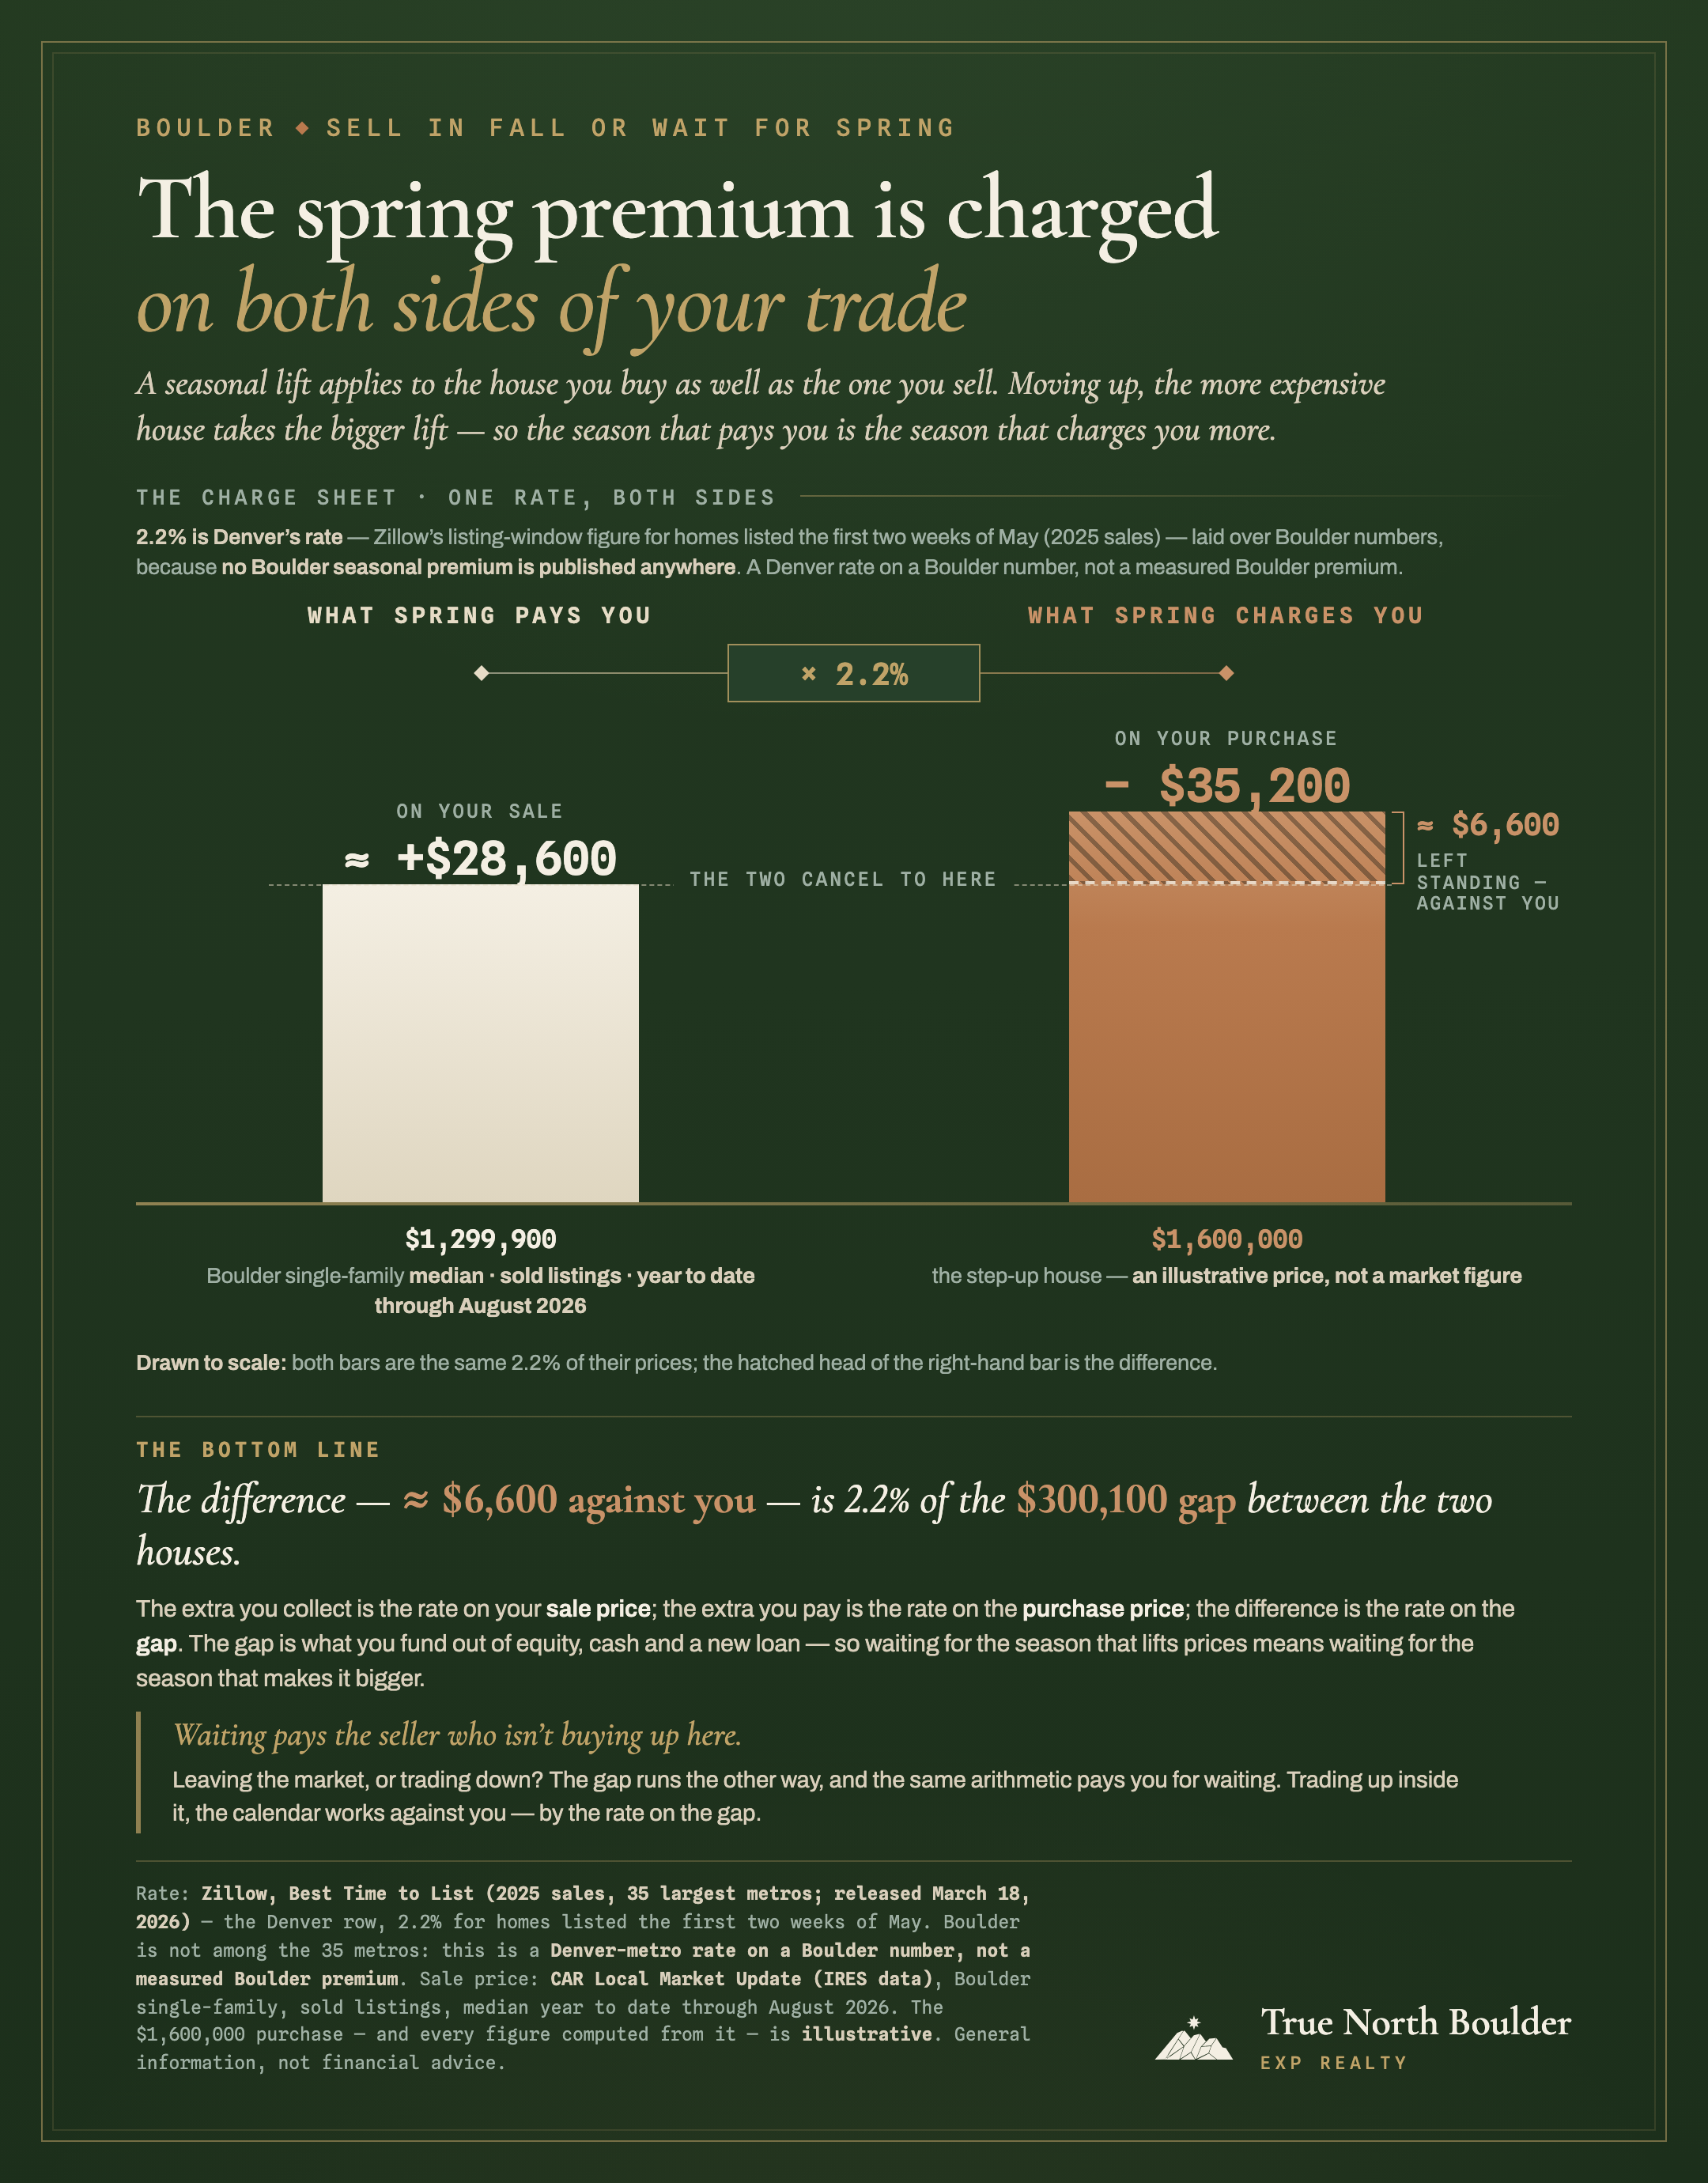
A seasonal premium lifts every house, including the one you are buying. On Boulder’s $1,299,900 single-family median (sold, year to date through August 2026) at Denver’s 2.2% listing-window rate, the lift on your sale is about $28,600; the same 2.2% on the more expensive house you buy is a bigger number, and the difference is 2.2% of the gap between them. The gap is what you fund, so waiting widens it.
This is the part the genre leaves out, and for a move-up seller it decides the question.
Almost without exception, the advice on this subject is written for a seller who sells a house and then walks away, and that was true of every page ranking for it when we checked. You're not that person. You're selling one Boulder home and buying a more expensive one, usually in the same season, often in the same month. That means a seasonal premium doesn't arrive as income. It arrives on both sides of your transaction.
Work it through with the nearest number we can source. Zillow's Denver figure, 2.2% for homes listed in the first two weeks of May, applied to Boulder's $1,299,900 median, the single-family sold median for the year to date through August 2026, is about $28,600 of extra sale price. That is a Denver metro rate laid over a Boulder number, not a measured Boulder premium: Boulder is its own metro area and appears in no seasonal table we can find. Now apply the same 2.2% to the home you're buying. It's the more expensive house, so it's the bigger number, and the difference lands against you.
The general form is simpler than the example. If one percentage lifts both houses, your net exposure is that percentage of the gap between them, not of your sale price, which is the number the advice quietly promises. The gap is what you were going to fund out of equity, cash and a new loan, so waiting for the season that lifts prices means waiting for the season that makes it bigger.
Run it on your own two numbers. Take what you expect to pay for the next house, subtract what you expect this one to sell for, and apply the same 2.2% to the gap between them. That is what waiting adds to the sum you have to cover out of equity, cash and a new loan, and unlike the carry it is not a monthly cost you can watch tick down. It arrives in one piece, on the side of the trade you are funding.
Read the sign, because it flips with the direction of the trade. If you are trading down, the gap is negative: you collect the premium on the larger house and pay it on the smaller one, and the difference lands in your favor. The same arithmetic that penalizes a move-up seller for waiting pays a downsizer for it.
The sticker gap on a bigger Boulder home already understates your true upgrade, because of the permanent tax and insurance reset you inherit the day you own it. Timing is that same asymmetry seen from another angle. The gap is the thing that moves, and almost nobody prices it.
Three honest limits, because the argument is only as good as its assumptions. It assumes the premium hits your purchase at roughly the rate it hits your sale, a metro average nobody has measured block by block here. It breaks if the house you are buying is new construction, where price is set by a release schedule and a quota rather than a season, and builder incentives tend to be at their best in the months this page is telling you to sell; that one breaks in your favor.
And it changes shape if you sell in one season and buy in another. That is not a loophole, it is the worst cell in this whole matrix: sell this autumn, buy next spring, and you take the lower number on the way out, pay the higher one on the way back in, and rent in between. If that is the shape of your move, the sequencing question is the urgent one and it is the one to settle first.
What does listing now do to the house you're buying?
The same thinning that helps your sale hurts your purchase. Boulder carried 206 active single-family listings in January against 327 in June, so the board you buy from is about 37% smaller too. Before you list, answer one question honestly: in the last sixty days, has anything come up you would actually have bought?
This page has so far used the number in one direction only. The thinning works on your purchase too. Boulder carried 206 active single-family listings in January against 327 in June, so the board you buy from is about 37% smaller as well. Before you list, answer one question honestly: in the last sixty days, has anything come up that you would actually have bought? If the answer is no, selling quickly into a thin market buys you a rental, a double move and a storage unit, and puts you back into the spring market as a buyer with no leverage and a deadline.
Two instruments exist for exactly that problem. A post-closing occupancy agreement, the Commission's PCO70, can give you up to 60 days in your own house after closing if the buyer agrees. The ceiling tracks the buyer's owner-occupancy loan terms rather than a state limit, so it is a term you negotiate, not one you can count on. And in a slower stretch a seller has fewer backup offers stacked behind yours, which is what a contingent offer has to compete with. Whether that changes how a seller actually treats it is not something we could find anyone measuring, any more than the claim about winter buyers above. Fewer houses to choose from, less competition for the ones that are there, and a contingency that finally gets read on its merits.
We have argued this before about scarcity: the condition helping your sale is usually the same one working against your purchase. Seasonality behaves the same way. The calendar advantage is real, and it belongs to the person who is not buying up here, whether leaving or trading down, rather than the person moving up inside it.
The number your carry has to beat
Every seller needs this number, and for one not buying up here it settles the question on its own: on Boulder’s single-family median, year to date through August 2026, at Denver’s 2.2% rate for homes listed in the first two weeks of May, the seasonal prize is about $28,600. Wait until April and that is near $4,770 a month; until late January, about $8,170 a month. If owning the house costs you less than that each month, waiting can pay.
For a seller who is not buying up in this market, the whole decision reduces to one comparison you can run on a napkin. If you are buying up, build the same number anyway; for you it is the larger of the two costs of waiting. The prize is the seasonal premium on your sale price, which is a different number from what you actually net. Run it on the Denver metro rate, 2.2% for homes listed in the first two weeks of May, the nearest published figure to us: on Boulder's $1,299,900 single-family median, year to date through August 2026, that is about $28,600.
The months are yours to choose, and that choice moves the number more than the premium does. October to April is about six months, which puts the prize near $4,770 for every month you wait. October to late January is about three and a half months, and the same prize then has to beat roughly $8,170 a month. That is the threshold, and you set half of it yourself. If owning the house costs you less than that a month, waiting can pay. If it costs more, waiting is a slow loss dressed up as patience.
For a move-up seller this threshold exercise applies harder, not less. There is no prize to divide, so there is no number to clear: every month you wait is carry paid against a negative return. Waiting costs you twice over, once in the carry, which is the big number and the one you compute below, and once in the widened gap, which is the one nobody tells you about.
Late January is not the halfway option. It is a position of its own: you list into a buyer pool that is rebuilding, against a board still well short of the 327 actives Boulder carried by June, and you close into the busiest part of the year.
Now the part we will not do for you. We have an interest in the answer, since our commission depends on a sale happening. So the arithmetic is yours and the number should be too. We are not going to publish a typical monthly carrying figure for a Boulder home, because no such number would help you. We do not know your loan balance or rate, your assessed value, your premium, your dues or your deferred maintenance. A specimen would be a plausible-looking substitute for the five minutes it takes to build the real one. Build it instead:
Start here
Pull one month’s actual outflow
Your mortgage statement gives you principal, interest and whatever tax and insurance is escrowed, in a single line you already have. Interest, tax and insurance are the real cost of waiting; the principal portion is not, because it comes back to you at closing, so strip it out if you want the honest number. A payoff quote with per-diem interest is a different document answering a different question: it belongs to net proceeds, not to this.
If tax and insurance are not escrowed, add them here
If your mortgage statement already includes them, they are counted and you skip this step. Adding them a second time is the most common way this number comes out wrong. If you pay them yourself, take the annual property tax from your county treasurer's bill and the annual premium from your insurance declarations page, and divide each by twelve. Colorado bills property tax in arrears, and at closing you credit the buyer for the days you owned; that moves when your money moves rather than adding to what you owe.
Add dues and the cost of staying presentable
HOA dues, utilities on a show-ready home, snow removal, and maintenance you would otherwise defer. A listed house costs more to run than a lived-in one.
Add what you would pay to live somewhere else
If waiting means a rental, a double move or storage, those months belong here too.
If the house will be empty, price the vacancy
Call your insurer before you move out, not after. Two different clauses on the standard homeowner form matter here, and they are not the same clause. Frozen-pipe damage in an unheated house, the Boulder-winter case, is excluded unless you used reasonable care to keep the heat on, or shut off the water and drained the systems; there is no day count on that one, so the heat stays on from the day you leave. Vacancy is a separate trigger: on the standard form, once the house has stood empty for more than 60 consecutive days, vandalism cover stops, and a carrier's own form can cut sooner and deeper than that. Wording varies by carrier, so ask what your policy says and what a vacancy endorsement costs. The same gap opens during a move-up overlap.
The comparison
Put the monthly total against the threshold
Under it, waiting can pay. Over it, you are buying a slightly better spring price with a certain monthly loss. If you are buying up, run the gap arithmetic first: it usually settles the question before this one does.
The last refusal: we will not forecast where rates will be next spring. The 30-year fixed averaged 6.66% in the week ending August 27, 2026, against 6.56% a year earlier. Where it sits in April is unknowable, and no forecast you'll hear between now and then deserves a place in this arithmetic. That uncertainty is not neutral. It is a risk you take on by waiting and cannot take on by selling now. It moves the price of the house you are buying as well as the pool of buyers for the one you are selling. The lock-in effect is the version of that risk a move-up seller feels from both directions at once.
Rates are not the only thing you cannot see from here. The seasonal prize is small enough that six months of ordinary market movement, in either direction, is the larger bet: Boulder went from 5.4 months of supply to 4.2 in a single year, August to August. Waiting for a low-single-digit premium means holding a much bigger position on the market itself, for months, to collect it.
Still deciding when to list?
The threshold above is a market number. Your own carrying cost is the one that settles it, and it takes a mortgage statement and a tax bill to pin down. If you are buying up, the gap to your next house settles it before the carry does. We can put those numbers side by side with you in one sitting, so that the people deciding this are working from the same figures.
What a fall listing has to do differently
On the Front Range three systems a buyer’s inspector cannot evaluate once the weather turns: irrigation, blown out early to mid October and untestable after; air conditioning or an evaporative cooler, not run roughly October through mid-May; and a snow-covered roof. Each comes back “not evaluated,” and an unknown gets priced against the seller.
If you do list in the fall, the transaction itself behaves differently, and Colorado inspection firms are consistent about what closes down and when. Irrigation gets blown out before the first hard freeze, early to mid October on the Front Range, and once winterized it cannot be pressure-tested. Air conditioning and evaporative coolers are not run in cold weather, roughly October through mid-May, because running them can damage them. A roof under snow cannot be walked, so its condition is not determined.
Notice what the three have in common. None comes back as a problem. They come back as unknowns, on a report your buyer is reading while deciding what to object to, and an unknown gets priced, objected to, or held back in escrow. Each of those outcomes is paid for by the seller. The counter-move is a pre-listing inspection done before winterization, which makes it late-September work rather than a November scramble. If you are reading this in the middle of September, that window is about two weeks wide. What a Boulder County inspection turns up is worth reading before you book one.
If the irrigation has already been blown out by the time you read this, the counter is documentation rather than testing. Get the blow-out invoice from whoever did it, the summer's HVAC service record, and any roof invoice or permit, and hand them over with the disclosures. A documented system is a different object from an unevaluated one, and that is the difference between a credit request and a shrug.
Radon deserves a line, because this is high-radon ground and the EPA action level is 4 pCi/L. The transaction test runs the same way in every season, but a winter reading catches the house at its worst: frozen soil caps the gas underneath, and a sealed, heated home gives it less to disperse into. That cuts one way for a seller. A buyer objecting on a winter number is objecting on the high end of that house's own range, so test early and know your own number rather than meeting theirs cold. The mechanism, and what a transaction test requires, are in our Boulder County inspection guide.
Photograph the exterior before the leaves go, while you still can: an October shoot is what your listing looks like until the day it sells. And know what the clock change does to your showings: once it is dark before people leave work, weekday evening showings largely stop and everything compresses into the weekend.
Price a fall listing to sell inside its own window. A spring listing priced four percent high gets rescued by the next tranche of buyers three weeks later. An October listing priced four percent high sits into December, collects a price-reduction history, and comes back in March as a stale listing against a board rebuilding toward the 327 actives Boulder carried by June.
Two things hold in any season. You price against the board of active listings, thinner in the fall, and thin does not mean weak: it means fewer reference points and a bigger penalty for guessing. Solds set your value and actives set your position, and the second half of that gets harder with fewer actives on the board. A failed attempt is also not a free option. Days on market and price-reduction history follow the listing into spring, which is exactly the mess a relisting has to unwind. Going early and going badly is worse than either choice made deliberately.
Should you sell this fall or wait for spring?
The spring premium in Boulder is worth low single digits, not the 16% you were promised, so waiting pays only if you are not buying up in this market and your carry stays under the monthly threshold. If you are trading up, you pay that same premium on the house you buy, and waiting widens the gap you have to fund.
Before the timing question gets to decide anything, three things sit above it, and two of them cost real money to the person who misses them. If you have already moved out, the clock on the capital-gains exclusion is running: the test is two of the last five years of ownership and use, and it is a threshold rather than a sliding scale, and half a year is a tenth of the window that decides whether up to $250,000 of gain, or $500,000 filing jointly, is sheltered or taxable. That is worth many multiples of the seasonal prize, and it is a CPA conversation before it is a listing-date one. If the house will stand empty while you wait, call your insurer before it does, for the vacancy reason in the carry list above. And if anything else is already leaning on this sale, that commitment picks your date, and nothing on this page overrides it.
If you are selling and not buying up here, whether leaving or trading down
Waiting can genuinely pay, but only if owning the house through those months costs you comfortably less than the monthly threshold above. Run that number first.
If you are trading up inside Boulder
List, and answer the buy-side question above before you do: in the last sixty days, has anything come up that you would actually have bought? If not, settle where you land before you list rather than after. The post-closing occupancy agreement above is a term you negotiate with your buyer, not one you can hold in advance, and a contingent offer needs a house to be contingent on. The premium you are waiting for is charged on the house you are buying too, and because that one costs more, the difference lands against you as a wider gap to fund.
If you are trading down
Waiting can genuinely pay you, and for the opposite reason. You collect the premium on the larger house and pay it on the smaller one, so the difference lands in your favor. Run the same monthly threshold above.
If you do not yet know whether you are buying here
Settle that first, because it decides this. The question underneath “when should I list” is almost always “do I sell first or buy first,” and that answer sets the list date, not the other way around.
This page has been about a calendar, and for most people asking, the calendar isn't really the decision. The buy-before-you-sell guide works the sequencing question properly, and the move-up seller's pillar guide covers the pricing, prep and net-proceeds work that follows once a date is set. Boulder's supply picture explains why both sides of your trade behave the way they do.
The bottom line
Boulder’s spring advantage is real, it is mostly about speed rather than price, and the price part is worth low single digits. That is enough to matter to a seller who is not buying up here, cashing out or trading down, and who can hold the house cheaply for a few months. It is not enough for a seller buying up in the same market, because there the premium is charged twice and the second charge is the larger one. So the question that decides your listing date is not a date at all. It is whether you are buying back in.
About this data, and the figures we will not publish
Boulder figures are town-level, single-family, sold listings from the CAR Local Market Update (IRES data). Days on market is an average, running list date to accepted offer, not to closing. Current-state anchors are the August 2026 report; the monthly series is labeled month by month, November through July in each of the two seasons. There is no August, September or October figure for either of the two past autumns in the series, and not because we did not look: our source publishes no August or September report for that stretch and the October batch is incomplete, so the earliest measured autumn month available to us is November. None of it is broken out for the $800K–$1.5M band, which sits below Boulder’s median in the more liquid tier while the town aggregate is pulled around by luxury stock that sits.
Four numbers we deliberately do not publish. There is no Boulder seasonal price premium anywhere we can cite. ATTOM publishes no metro breakout at all, and Zillow’s 35-metro table stops well short of Boulder, which is its own metro area and not part of Denver’s. The nearest published figure is Denver’s: 2.2%, about $13,100, for the first two weeks of May. We use it as the nearest thing to a local rate, labeled as Denver metro, never as a Boulder measurement. There is no band-level seasonality published by anyone; a broker-side IRES pull would settle it. There is no typical monthly carrying figure, because yours turns on a loan balance, a tax bill and dues we do not know. And there is no rate forecast: we cite the level with its week and refuse the direction.
One claim we could not stand behind: that winter buyers are more serious. It runs throughout the industry and we found no independent research behind it, so it appears here only as a claim we decline to repeat.
Sources & data notes
- The capital-gains exclusion. 26 U.S.C. § 121(a) and (b)(2) — the ownership-and-use test and the $250,000 / $500,000 caps; IRS Publication 523 is the plain-language version. It is a threshold rather than a sliding scale.
- The vacancy and freezing provisions. ISO Homeowners 3 – Special Form, HO 00 03 05 11, Section I – Perils Insured Against, A.2.c: (1) freezing of plumbing, heating, AC, sprinkler or appliances is excluded unless the insured used reasonable care to maintain heat, or to shut off the water supply and drain the systems (no day count); (4) vandalism or malicious mischief is excluded if the dwelling has been vacant for more than 60 consecutive days. Same language in the 10 00 edition. Carrier forms and vacancy endorsements vary from the ISO base.
- Post-closing occupancy. CREC/DORA promulgated form PCO70. Whether a buyer agrees to one is a negotiation, not a right.
- Boulder days on market, homes sold, active inventory, percent of list price received, median and average sale price · CAR Local Market Update · Boulder (data from IRES, LLC), monthly reports December 2024 through August 2026; single-family, sold listings. Current-state anchors from the August 2026 report (“Current as of September 3, 2026”): median $1,157,500 on the month (62 sales) and $1,299,900 year to date, average $1,555,989, 69 days on market (72 year to date), 4.2 months of supply against 5.4 a year earlier, 62 sold, 304 active, 97.5% of list. The report excludes for-sale-by-owner sales and not all new construction, and notes that a single month can look extreme on a small sample. Its concessions footnote attaches to the median and average sale price as well as to percent of list received, so seller concessions are invisible in all three.
- Seasonal seller premium by month, mix-controlled · ATTOM, Best Days to Sell a Home (2026 analysis); 52 million single-family and condo sales, 2015–2025, comparing median sale price on each closing day against the median automated valuation of those same homes at the time of sale, minimum 10,000 sales per day. March 10.7% highest, October 7.9% lowest. National; no metro breakout published.
- Best listing window, 1.7% / about $6,000 · Zillow, Best Time to List analysis of 2025 sales across the 35 largest metros, released March 18, 2026 (Zillow newsroom). The national figure covers homes listed in the last two weeks of May. The release also carries a 35-metro table: the Denver row reads 2.2% and about $13,100, for the FIRST two weeks of May, and that is the rate this page illustrates with. Boulder is not among the 35 metros. The release publishes no methodology section.
- “16% more expensive in June” · National Association of Realtors, Economists’ Outlook, April 29, 2024. The article states the figure and names no data source or method for it.
- 30-year fixed mortgage average 6.66%, week ending August 27, 2026 (6.65% prior week, 6.56% a year earlier) · Freddie Mac Primary Mortgage Market Survey. Weekly; re-verify before relying on the level.
- Radon testing in a real-estate transaction: short-term test under closed-building conditions, closed at least 12 hours before a test running under four days; action level 4 pCi/L · U.S. EPA, Home Buyer’s and Seller’s Guide to Radon. Seasonal direction and the statewide share above the action level · Larimer County Department of Health and Environment with CSU Extension, January 7, 2026: winter testing “provides the most accurate assessment of your home’s safety”, and “in Colorado, about half the homes have radon levels higher than the U.S. Environmental Protection Agency ‘recommended action level’”. The seasonal magnitude is deliberately not quantified here.
- Winter inspection limits (irrigation blown out before the first hard freeze, early to mid October on the Front Range and untestable once winterized; air conditioning and evaporative coolers not operated roughly October to mid-May; snow-covered roofs not walked) · Colorado inspection firms, attributed in the text as trade guidance rather than a single primary source.
- Colorado property tax is billed in arrears and prorated at closing. Specific due dates are not stated here because published sources disagree and the schedule has been legislatively adjusted; confirm the current year with the Boulder County Treasurer.
Frequently asked
Is spring really the best time to sell a house in Boulder?+
Spring is the fastest time to sell in Boulder, and only slightly the most expensive one. Boulder single-family homes go under contract in an average of 48 to 68 days in April through June, against 72 to 111 days in December through February, a pattern that repeats across two independent years of CAR Local Market Update data (IRES data, sold single-family listings, through July 2026). The price side is much smaller than the timing side. Two national studies that compare the same homes rather than whichever homes happened to sell put the seasonal price effect in low single digits, not the double digits usually quoted.
How much more do homes actually sell for in spring?+
Low single digits, on the two analyses that control for which houses sold. ATTOM compared sale prices against an automated valuation of those same homes across 52 million single-family and condo sales from 2015 to 2025, and found the seller premium ranged from 10.7 percent in March to 7.9 percent in October, a best-to-worst spread of 2.8 percentage points. Zillow, analyzing 2025 sales across the 35 largest metros, found homes listed in the last two weeks of May sold for 1.7 percent more, about 6,000 dollars on a typical U.S. home. Both are national studies. Neither publishes a Boulder figure; Zillow's metro table gets as close as Denver, at 2.2 percent and about 13,100 dollars for the first two weeks of May.
How long do Boulder homes take to sell in winter?+
Longer, by roughly a month. Boulder single-family homes averaged 86 days on market in December 2025, 111 in January 2026 and 72 in February 2026, against 48 in April 2026 and 68 in June 2026 (CAR Local Market Update, IRES data, sold single-family listings). The prior year ran the same shape: 94 days in December 2024 and 95 in January 2025, against 54 in June 2025. Days on market here is an average and measures list date to accepted offer, not to closing.
Is there less competition if I list in the fall or winter?+
Yes, and there are far fewer buyers too. In Boulder in 2026, January carried 206 active single-family listings against 327 in June, about 37% fewer competitors. Over the same months closings ran 39 in January against 112 in June, about two-thirds fewer (CAR Local Market Update, IRES data, 2026 only). Both sides of the market thin out in winter, but the buyer side thins roughly twice as far. Less competition is true, and it is the smaller half of the trade.
What does it cost me to wait until spring?+
Whatever it costs you to own the house for those months, and that number is yours rather than a market average. Add interest, property tax, insurance, any HOA dues, upkeep and utilities on a home you are trying to keep presentable, and anything you would pay to live somewhere else in the meantime. Principal is not a cost of waiting; it comes back to you at closing. Compare that monthly total against the seasonal prize divided by the months you would wait. We deliberately do not publish a typical monthly carrying figure, because we do not know your loan balance, your tax bill or your dues, and a made-up specimen would be worse than none.
Should I wait for spring if I am also buying a home?+
Usually no. For a move-up seller the spring premium is charged twice, once on each side of the trade, and the second charge is the larger one. A seasonal premium applies to the house you buy as well as the house you sell, and for a move-up seller the house being bought is the more expensive one. If the same percentage lifts both, the extra you collect is that percentage of your sale price, the extra you pay is that percentage of the purchase price, and the difference is that percentage of the gap between them. The gap is the number you actually have to fund, so waiting widens it. The calendar advantage belongs to a seller who is not buying up here, whether leaving or trading down, not to one moving up inside it.
True North Boulder is a real-estate team with eXp Realty, serving Boulder and the northern Front Range of Colorado. This guide is educational and reflects market conditions as of August 2026 (Boulder data vintage August 2026, with the monthly series labeled through July 2026); it is not legal, tax, or financial advice. Confirm your own numbers with your lender, your CPA, your insurer and, where appropriate, a Colorado real-estate attorney before you act on a listing date.
True North Boulder, brokered by eXp Realty.