Longmont Housing Market Report (Updated Monthly)
Longmont single-family runs 2.6 months of supply against Boulder's 4.7, so the corridor is the tighter market, not the looser one. And the median is still down about 4.8% year to date. Both are true at once, and together they change how a move-up trade has to be financed.
Last updated: July 2026. Figures are single-family sold data for the city of Longmont, from the Colorado Association of REALTORS Local Market Update (data from IRES, the Front Range MLS), May 2026.
The Longmont housing market is running in two directions at once. Single-family closed at a median of $600,000 year to date, down about 4.8%, while months of supply tightened to 2.6 against Boulder's 4.7 (CAR/IRES, May 2026). Most coverage of this market picks one of those and ignores the other. Hold both, because together they invert the trade you were planning. Sell in Boulder, buy in Longmont, and you're now selling into the softer market and buying into the tighter one. That's the harder direction, and it's the one most move-up owners here are pointed in.
One thing we won't do is turn that 4.8% into a statement about your house. A town median can't. Here's what it can.
What's the Longmont median right now?
Longmont single-family closed at a median of $603,500 in May 2026, and $600,000 year to date, about 4.8% below the same stretch last year. The year-to-date figure is the one to hold onto. A single month rests on 130 sales, and the report prints its own warning: activity for one month can look extreme on a small sample. Same month against last May, Longmont came in 9.7% lower. But on that same report, in that same month, Boulder's median moved 1.9% the other way while its year-to-date fell about 5%. Single-month medians swing in both directions at once. We'll cite the year to date and not build a story on a month.
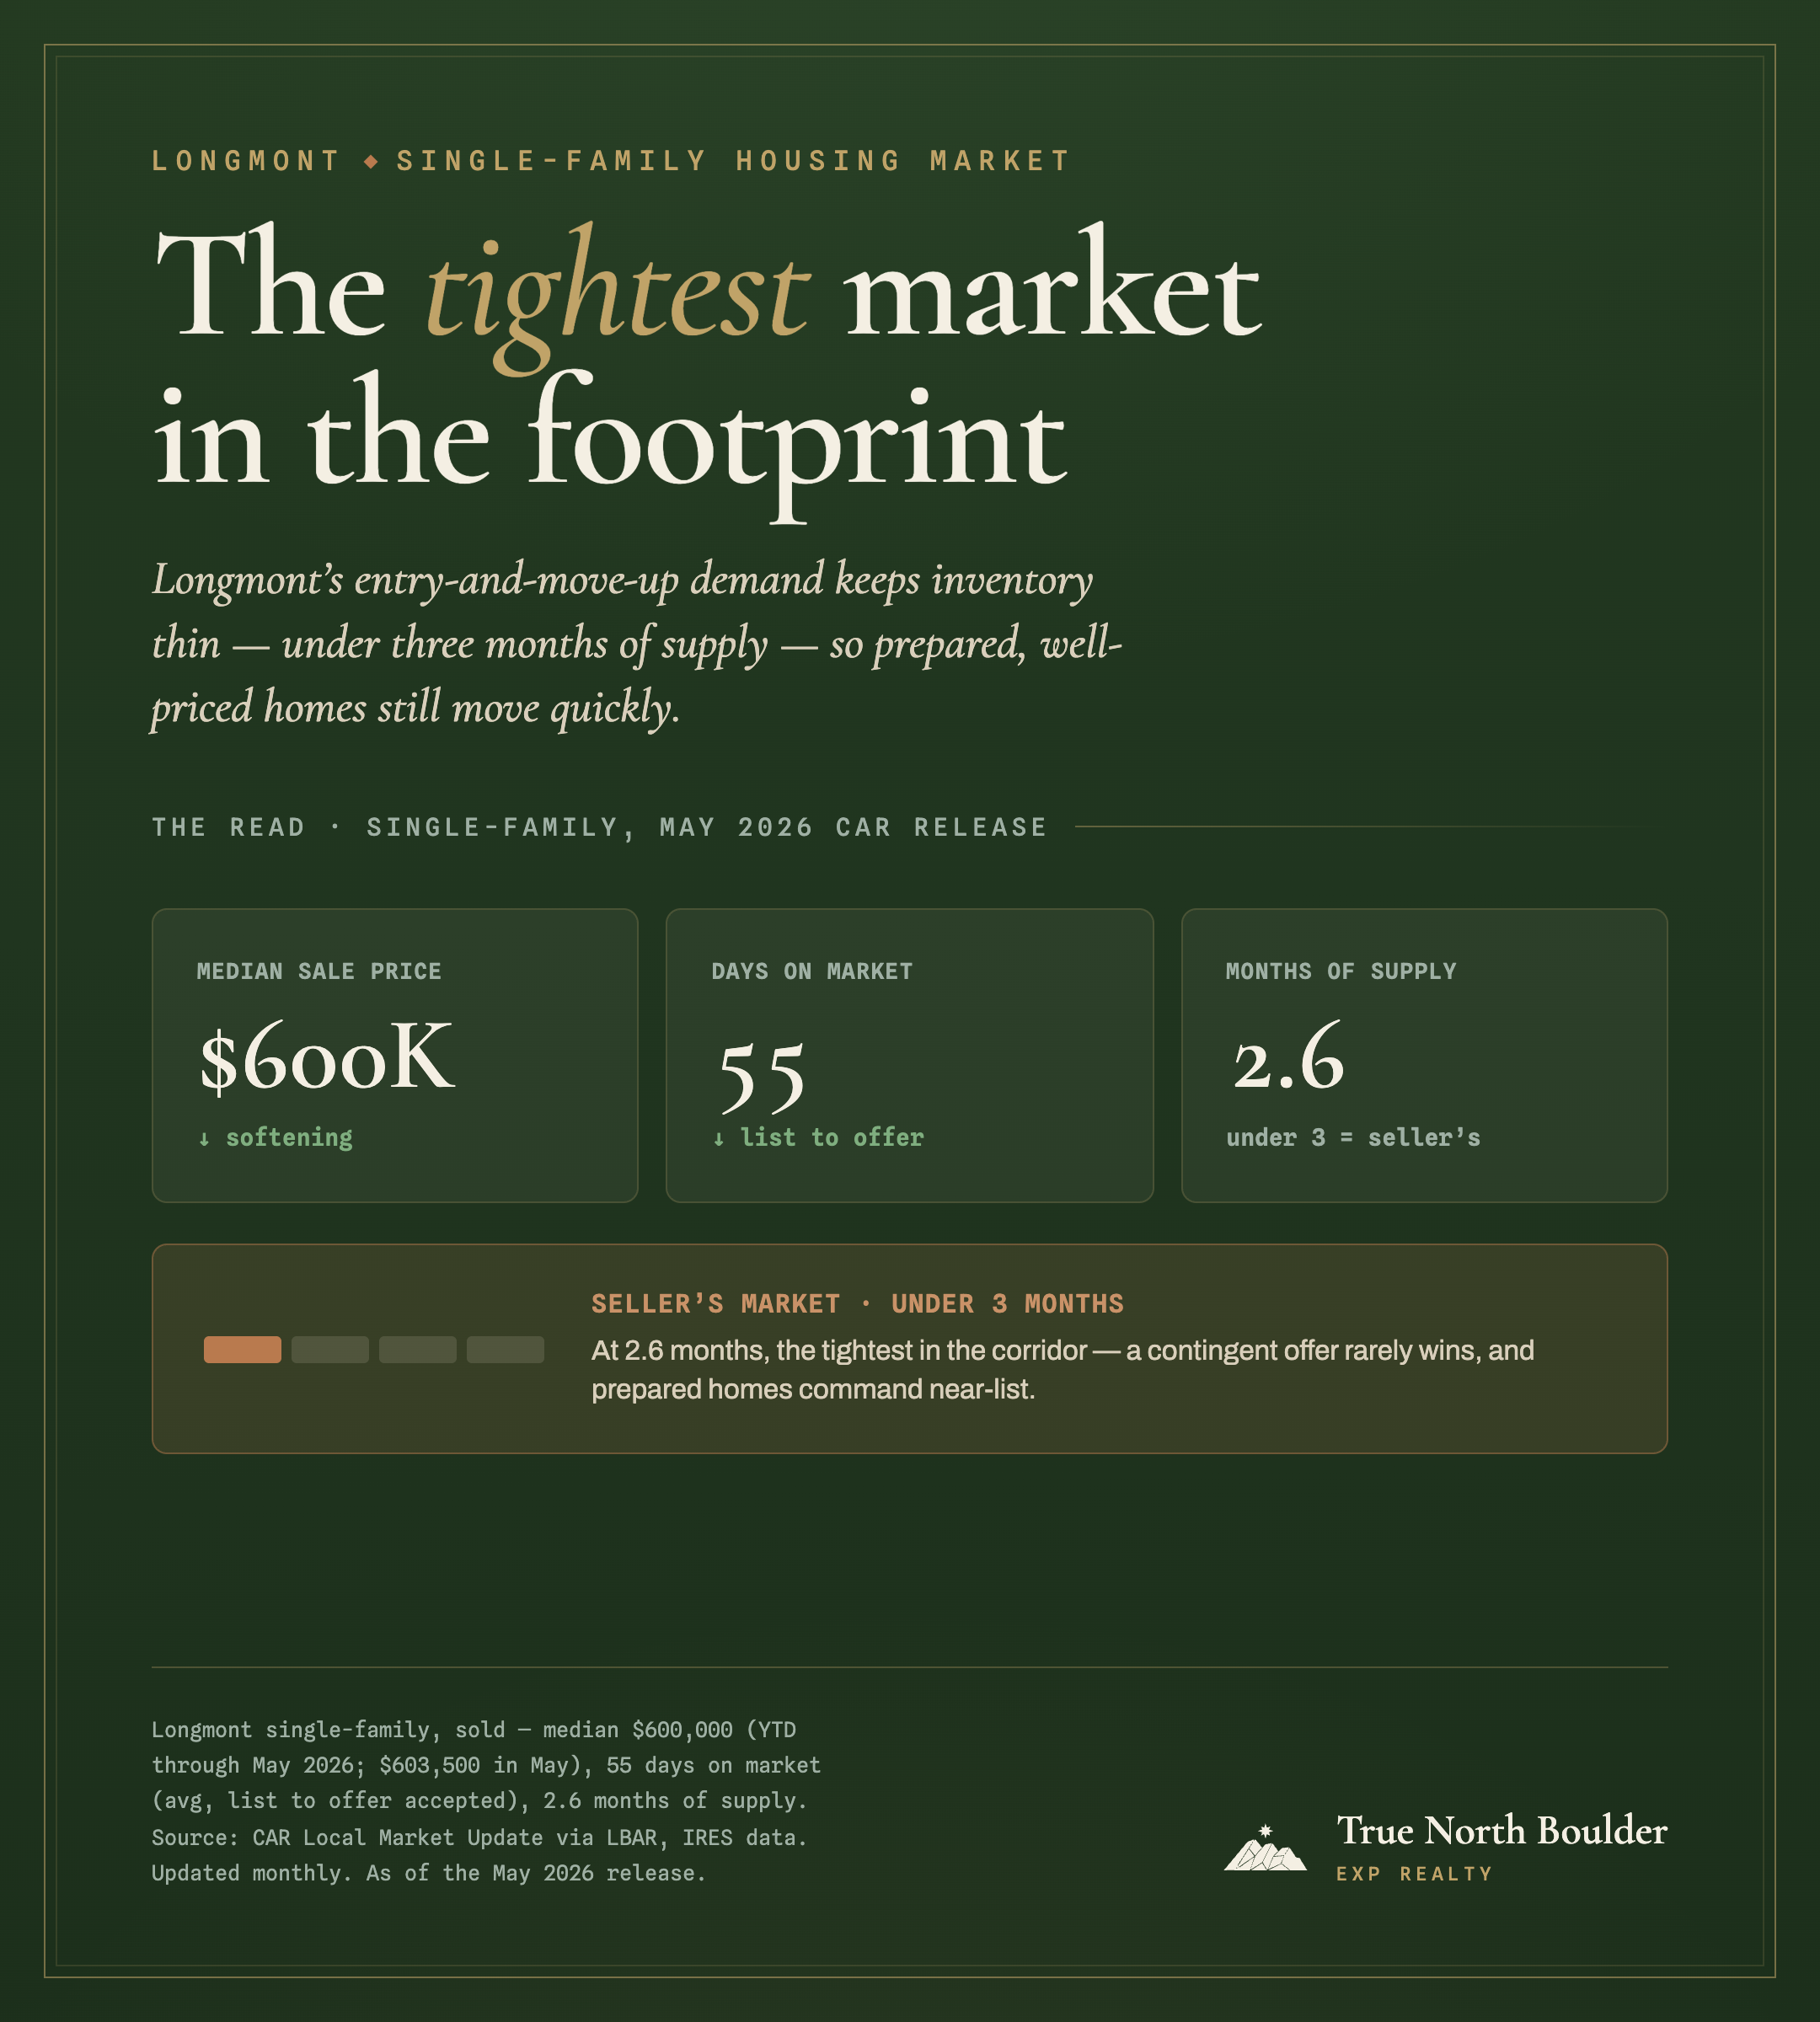
Read those figures the way we compile them: single-family, sold, city of Longmont. And note the one number we deliberately won't publish.
About this data, and the number we won't publish
Every figure here is single-family, sold, for the city of Longmont, from the Colorado Association of REALTORS Local Market Update, built on IRES MLS data and published free each month. Medians and averages exclude seller concessions.
We won't publish a months-of-supply figure for the $800K to $1.5M band. The 2.6 months above is the whole town, and half of Longmont's single-family sales closed below $603,500, so the band you shop sits in the top slice of that distribution and may well be looser. Nobody publishes a band-level breakout; it takes a direct MLS pull. If you're transacting in that band, ask us to pull yours. It's a specific question with a specific answer, and a real band-level figure for your target home beats a manufactured town average every time.
If prices are down, how is supply tight?
Because supply and price answer different questions, and a median answers neither one cleanly. Months of supply tells you how fast the market clears at the prices being asked. The median tells you the middle of what actually sold, which moves when the mix of what sold moves, not only when houses change in value.
So here is the line we will hold. What's down 4.8% is the price of what sold. That isn't the same as saying your house is worth 4.8% less. A town median can't separate a change in value from a change in what happened to trade. The instrument that can is a repeat-sales index, which tracks the same homes selling twice. The FHFA publishes one quarterly for the Boulder metro area, which includes Longmont, and it's the number to watch if you want value rather than mix.
What we can say is that the decline isn't a Longmont quirk. Boulder's year-to-date median is down about 5% on completely different housing stock. Loveland, just as tight at 2.7 months of supply, posted a median that went up, 1.5% on the year. Tightness and price direction are not the same variable.
One number you'll see quoted everywhere deserves a definition, because almost nobody gives it one. Longmont homes sold at 99.4% of list price. That's the last list price, after any reductions, and it excludes seller concessions. A home listed at $700,000, cut to $625,000, and sold at $621,000 received 99.4% of list and 88.7% of its original ask. So it isn't evidence that prices are holding. It supports exactly one statement: homes that sell are closing very close to their final asking price.
How fast are homes really selling?
Fifty-five days from listing to an accepted offer, on average, in May, down from 61 a year ago, and 64 year to date, flat against last year. That is the single-family number. Longmont townhomes and condos took 86 days, and their supply is running at 4.7 months against single-family's 2.6. They're two different markets wearing one town's name, and any figure that blends them is telling you about neither.
Even inside single-family, the average hides the split that decides your outcome. Turnkey, sensibly priced homes go under contract quickly, sometimes with competition. Dated or ambitiously priced homes sit and drag the average up. The useful question is never how long Longmont homes take. It's which side of that split your house, or the one you're bidding on, lands on.
Is the Longmont housing market a buyer's or a seller's market?
A seller's market by the conventional measure, and right now a tighter one than Boulder. Longmont single-family supply fell to 2.6 months from 3.3 a year ago. Under roughly three months is read as favoring sellers, over six as favoring buyers. Boulder sits at 4.7.
| Single-family, May 2026 | Longmont | Boulder |
|---|---|---|
| Median sale price | $603,500 | $1,325,000 |
| Months of supply | 2.6 (from 3.3) | 4.7 (from 6.4) |
| Days on market | 55 | 60 |
| Median, year to date | $600,000 (−4.8%) | $1,300,000 (about −5%) |
Colorado Association of REALTORS Local Market Updates for Longmont and Boulder. Data from IRES, single-family, May 2026. Town-level figures, not band-level.
Two honest caveats. Boulder is tightening fast, 6.4 months to 4.7 in a year, so this is a snapshot of a closing gap rather than a permanent condition. And both aggregates are town figures, not band figures. We'd expect each to be distorted at its ends: Boulder's by a luxury tail that sits, Longmont's by entry stock that clears quickly. So the inversion may be partly an artifact of that, and we can't measure how much until a band-level pull exists.
What should move-up buyers and sellers actually do?
Recognize that the usual trade has flipped. Selling in Boulder to buy in Longmont now means selling into the softer market and buying into the tighter one. That's the hard direction, and it has to be financed accordingly.
- A home-sale contingency rarely wins a well-priced home here. Where it's accepted, you pay for it: in price, in a kick-out clause the seller can exercise on a better offer, or in a compressed deadline. Plan on writing non-contingent, which means the money has to exist before you write.
- If a HELOC is part of your plan, open it before the house hits the MLS. Lenders generally won't originate a home-equity line on a property that's already listed, and a Coming Soon status is a listing they can see. Some will also suspend further draws once they know it's on the market; your line agreement governs, and you don't want to be arguing about that mid-move. Build in the clock, too: underwriting runs weeks, and a line on your primary residence carries a three-business-day right of rescission before you can draw. It's an easy trap to walk into, because a HELOC feels like something you arrange when you need the money. By then you've listed.
- Bridge financing gets harder on a softening departing residence. A bridge lender sizes the loan against your departing home's appraised value at a maximum combined loan-to-value, so a soft appraisal shrinks the loan directly, trimming your down payment at exactly the moment you need a clean, non-contingent offer. You're also generally underwritten as though you're carrying both payments. The soft sell-side quietly degrades your buy-side, and that compounding is the real risk in this direction. We walk through the trade-offs in bridge loan vs. sale contingency.
- Decide your appraisal gap on the contract, not in your head. If you go above ask, the appraisal has to support it, and we've just told you we can't say what the upper-tier comp set is doing. That's exactly why you fix your number in advance. In Colorado you do this on paper: the appraisal provision in the standard contract lets you name the amount you'll cover above the appraised value. That amount is cash, on top of your down payment.
- Two more, briefly. A rent-back is negotiated, not granted, and owner-occupant financing generally requires your buyer to occupy within 60 days, so keep any leaseback short. And under the 2026 rules your buyer-agency agreement is signed before you tour: sign it at a table, not in a driveway. It can be scoped to a single property or a short window. Commissions are not set by law and remain fully negotiable, and buyer-broker compensation is no longer offered on the MLS, so budget to pay it or build it into your offer.
If you're the Longmont seller, the number that should worry you isn't the median. It's the calendar. At 2.6 months of supply your house will very likely sell. The risk isn't whether. It's when, relative to the home you're buying. Fifty-five days is an average from listing to accepted offer, and it tells you nothing about the four to six weeks after that. Work backwards from the closing you need on the buy side, not forwards from the day you feel ready to list. The buy-before-you-sell playbook walks through the orders that work.
And if you're going the other way, selling in Longmont to buy in Boulder, you have the easy direction of this trade for once. You're selling into the tighter market and buying into the looser one. The contingency a Longmont seller would laugh at is a more plausible ask against a Boulder seller sitting at 4.7 months.
Watch the tax line, not just the price
Longmont's total mill levy varies parcel by parcel. The city's rate is one piece, but a home inside a special or metropolitan district can carry extra mills or a separate debt assessment, so two homes at the same price across town can hand you very different annual bills. Longmont has been notably restrictive here: Mountain Brook is the only residential metro district approved since the city reinstated them in 2019, and Council has since moved to limit them further. That's a quiet advantage over faster-growing corridor towns. One more local wrinkle: Longmont sits in two counties, most of it in Boulder County, but the east side in Weld. Pull the itemized mills for your exact parcel from the right county's assessor before a listing wins you over.
What's driving Longmont's market?
The price gap to Boulder, mostly. Boulder's single-family median is $1,325,000 against Longmont's $603,500: roughly 2.2 times, comparing like to like. Everything else here is context for that one number.
- The employment base is broad. Longmont's job base spans advanced manufacturing, technology, and healthcare, with UCHealth Longs Peak Hospital anchoring the medical side, rather than resting on a single employer. Check the City of Longmont's current major-employer list before you rely on any one name. The roster moves.
- Schools. Longmont is served by St. Vrain Valley Schools, which operates its Innovation Center in the city. Assignment is by address and ratings vary school to school, so confirm any specific home against the district's boundary finder rather than a neighborhood's reputation.
- The commute is being rebuilt. CDOT's CO 119 (Diagonal) project, a nine-mile bikeway plus faster bus service between Longmont and Boulder, is scheduled to finish in spring 2027. Which is to say: after your closing, before your resale.
One local overlay to check before you write an offer: parts of Longmont along the St. Vrain sit in FEMA-mapped floodplain, and map revisions are still working their way through FEMA as the city's Resilient St. Vrain project completes each reach. That affects insurance cost and seller disclosure, and a parcel's status can still change. Water, not wildfire, is Longmont's quiet gotcha.
The honest take
The question underneath all of this is usually the same one: am I selling at the bottom? Nobody can answer that, and anyone who tells you they can is guessing with your money. What we can tell you is that the corridor isn't moving in one direction. Longmont's median is down 4.8% year to date. Loveland's is up 1.5%. Both towns are clearing in under three months of supply. That isn't a market in freefall. It's a market that has stopped paying for an ambitious ask. If your house is priced right and prepped, it isn't sitting. And if you're trading up out of it, the softness on your sell side and the tightness on your buy side are the same problem, which is why the money has to be settled before the sign goes in the yard, not after.
We won't publish a band number. We will build your comp set.
A comp set at your price and your product, not a town average. That is a CMA, and it is the honest answer to what your home is worth.
Frequently asked
What is the median home price in Longmont?+
Longmont's single-family median sale price was $603,500 in May 2026, and $600,000 year to date, down about 4.8% from the same period last year (Colorado Association of REALTORS Local Market Update, data from IRES, May 2026). That is the single-family figure, which is the one a move-up buyer actually transacts on. Longmont townhomes and condos are a separate market entirely, with a median of $475,000. The $800K–$1.5M move-up band trades well above the town median.
Is the Longmont housing market a buyer's or a seller's market?+
By the standard measure, a seller's market. Longmont single-family carries 2.6 months of supply, down from 3.3 a year ago (CAR/IRES, May 2026), and under roughly three months is conventionally read as favoring sellers. It is also tighter than Boulder, which runs 4.7 months. But tight supply is a statement about how quickly homes clear, not about price: Longmont's median is still down about 4.8% year to date. Homes are clearing quickly. You will also still compete on price.
Is Longmont tighter than Boulder right now?+
Yes, at the town level. Longmont single-family runs 2.6 months of supply against Boulder's 4.7 (CAR/IRES, May 2026), and Longmont homes go under contract in 55 days against Boulder's 60. That inverts the usual story, and it matters: the classic move-up trade (sell in Boulder, buy in Longmont) now means selling into the softer market and buying into the tighter one. Note that Boulder is closing the gap fast, from 6.4 months a year ago.
Do Longmont homes sell for asking price?+
Longmont single-family homes sold at 99.4% of list price in May 2026 (CAR/IRES). But that is the LAST list price, after any reductions, and it excludes seller concessions. A home listed at $700,000, cut to $625,000, and sold at $621,000 received 99.4% of list and 88.7% of its original ask. It is not evidence that prices are holding. It shows only that homes which sell close near their final asking price.
Are home prices falling in Longmont?+
Longmont's single-family median is down about 4.8% year to date, to $600,000 (CAR/IRES, May 2026). That is a fall in the price of what sold, which is not proof that a given home is worth 4.8% less. A town median moves when the mix of homes that traded moves, not only when values change. The instrument that separates the two is a repeat-sales index; the FHFA publishes one quarterly for the Boulder metro area, which includes Longmont.
How often is this report updated?+
Monthly, at this same URL, with a refreshed last-updated date. The figures come from the Colorado Association of REALTORS Local Market Update for Longmont, which is built on IRES MLS data and published roughly four weeks after month end.
Sources & data notes
- All Longmont, Boulder and Loveland figures: Colorado Association of REALTORS Local Market Update, single-family, sold, May 2026 (and year-to-date through May), published free each month by the Loveland-Berthoud Association of REALTORS. The report's own footnote reads: "Current as of June 3, 2026. All data from IRES, LLC and REcolorado." Longmont · Boulder · Loveland.
- Loveland comparison: single-family median $535,000 (+3.1%) in May, $525,000 (+1.5%) year to date, on 126 sales, with 2.7 months of supply. Same source and window as above.
- Basis matters here. These are single-family figures. Longmont townhouse/condo is a separate market (median $475,000, 86 days, 4.7 months of supply) and any blended "Longmont median" mixes the two. Medians, averages, and percent-of-list all exclude seller concessions.
- "Percent of list price received" (99.4%) is measured against the last list price, after any reductions, not the original. It is not evidence that prices are holding.
- Days on market, as this report measures it, is an average running from listing to accepted offer, not to closing.
- Months of supply is inventory divided by the average monthly pending sales of the trailing twelve months, via ShowingTime, which generates the report. Under roughly three is conventionally read as favoring sellers; over six, buyers.
- Mountain Brook as the only residential metro district approved since Longmont reinstated them in February 2019, and Council's subsequent move to limit their creation (Longmont Leader).
- Single-month figures are noisy. The report carries its own caveat that one month can look extreme on a small sample (Longmont: 130 single-family sales in May). We lead with year-to-date for that reason.
- What we do not publish: a months-of-supply or median figure for the $800K–$1.5M band. No public source breaks it out; a direct IRES broker pull is required, and we plan to commission one. We would rather label a town figure honestly than invent a band figure.
- Correction (July 2026): an earlier version of this report cited a blended, all-property-type median of about $555,000, days on market of about 41, and roughly four months of supply described as "balanced." Those were public-portal figures on the wrong basis, and the supply reading was wrong in direction. The single-family data above replaces them.
- St. Vrain Valley Schools ranking and Innovation Center, per St. Vrain Valley Schools. Boundaries are per address; confirm against the district's finder.
- CO 119 (Diagonal) Safety, Mobility and Bikeway project, completion scheduled spring 2027 (CDOT).
- Floodplain mapping and the Resilient St. Vrain Project (City of Longmont). Map revisions are still working their way through FEMA as each reach of the project completes, so a parcel's status can change; confirm any address directly.
- A repeat-sales index (which tracks the same homes selling twice, and so controls for changes in what sold) is the instrument that can separate value from mix. The FHFA House Price Index publishes one quarterly for the Boulder metro area.
Get the monthly Longmont read.
Real MLS numbers, and the basis they're actually measured on, about once a month. Unsubscribe any time; see our privacy policy.
See also: the Longmont market and neighborhood hub · the buy-before-you-sell playbook · bridge loan vs. sale contingency · the Boulder vs. Longmont comparison. External references: CAR Local Market Update — Longmont (IRES data) · Boulder County Assessor · CDOT CO 119 Safety, Mobility & Bikeway project.
Daniel Hsieh is a licensed Colorado real estate broker with True North Boulder, brokered by eXp Realty. Market figures are month-old MLS data and are not a valuation of any specific home; verify any number against current IRES or county data before acting. This report is general market information, not lending, tax, or legal advice: confirm your specifics with your lender, CPA, or attorney.