Berthoud Housing Market Report (Updated Monthly)
Berthoud runs 5.8 months of single-family supply, up from 4.2 a year ago, the one corridor town that loosened. Its month median went $722,500 in June, $590,000 in July, $650,000 in August, on under 30 sales each: a construction-mix artifact, not a price.
Last updated: October 2026. Figures are single-family sold data for the town of Berthoud, from the Colorado Association of REALTORS Local Market Update (data from IRES, the Front Range MLS): the latest release is August 2026, stamped current as of September 3 (the September update is expected in late October).
Berthoud carries 5.8 months of single-family supply, the only town in the footprint that loosened over the past year, from 4.2 (CAR/IRES, August 2026). Where Longmont and Loveland run around three months, Berthoud is the one corridor town where the leverage has been shifting toward the buyer; Boulder sits between them at 4.2. It spent June and July just above six months, the point past which ShowingTime, the reports' producer, reads a market as favoring buyers, and sits just under it in August, a 0.4-month move we read as the same market, not a turn. And there's a second thing that makes Berthoud different, which the last three releases demonstrate better than any argument we could write: its month median read $722,500 in June, $590,000 in July and $650,000 in August, on fewer than 30 sales each time, while the year-to-date line moved by no more than $10,000. That is a construction-mix artifact, not a market event, and it is why this report gives you the level and refuses to quote an appreciation rate.
What's the Berthoud median, and why won't you quote a change?
Berthoud single-family sits in the mid-$600Ks: about $639,450 year to date through August 2026, with a much higher average near $763,001. We are not going to give you an August month figure as a level. Twenty-five homes sold, below the roughly 30-sale floor we hold for quoting a monthly median at all, and you can see why in the numbers themselves: the month median printed $722,500 in June, $590,000 in July and $650,000 in August. The town did not lose and then regain six figures in sixty days. A different handful of new builds closed each month.
That gap between the year-to-date median and the average, roughly $124,000, is the same tell: new construction pulling the top of the market up. Berthoud is a small, build-heavy town where roughly a third of the homes went up in the 2010s. With samples this thin and a stock this varied, the median moves on which houses happened to close, not on whether values rose or fell. Lead with the year-to-date level, every time.
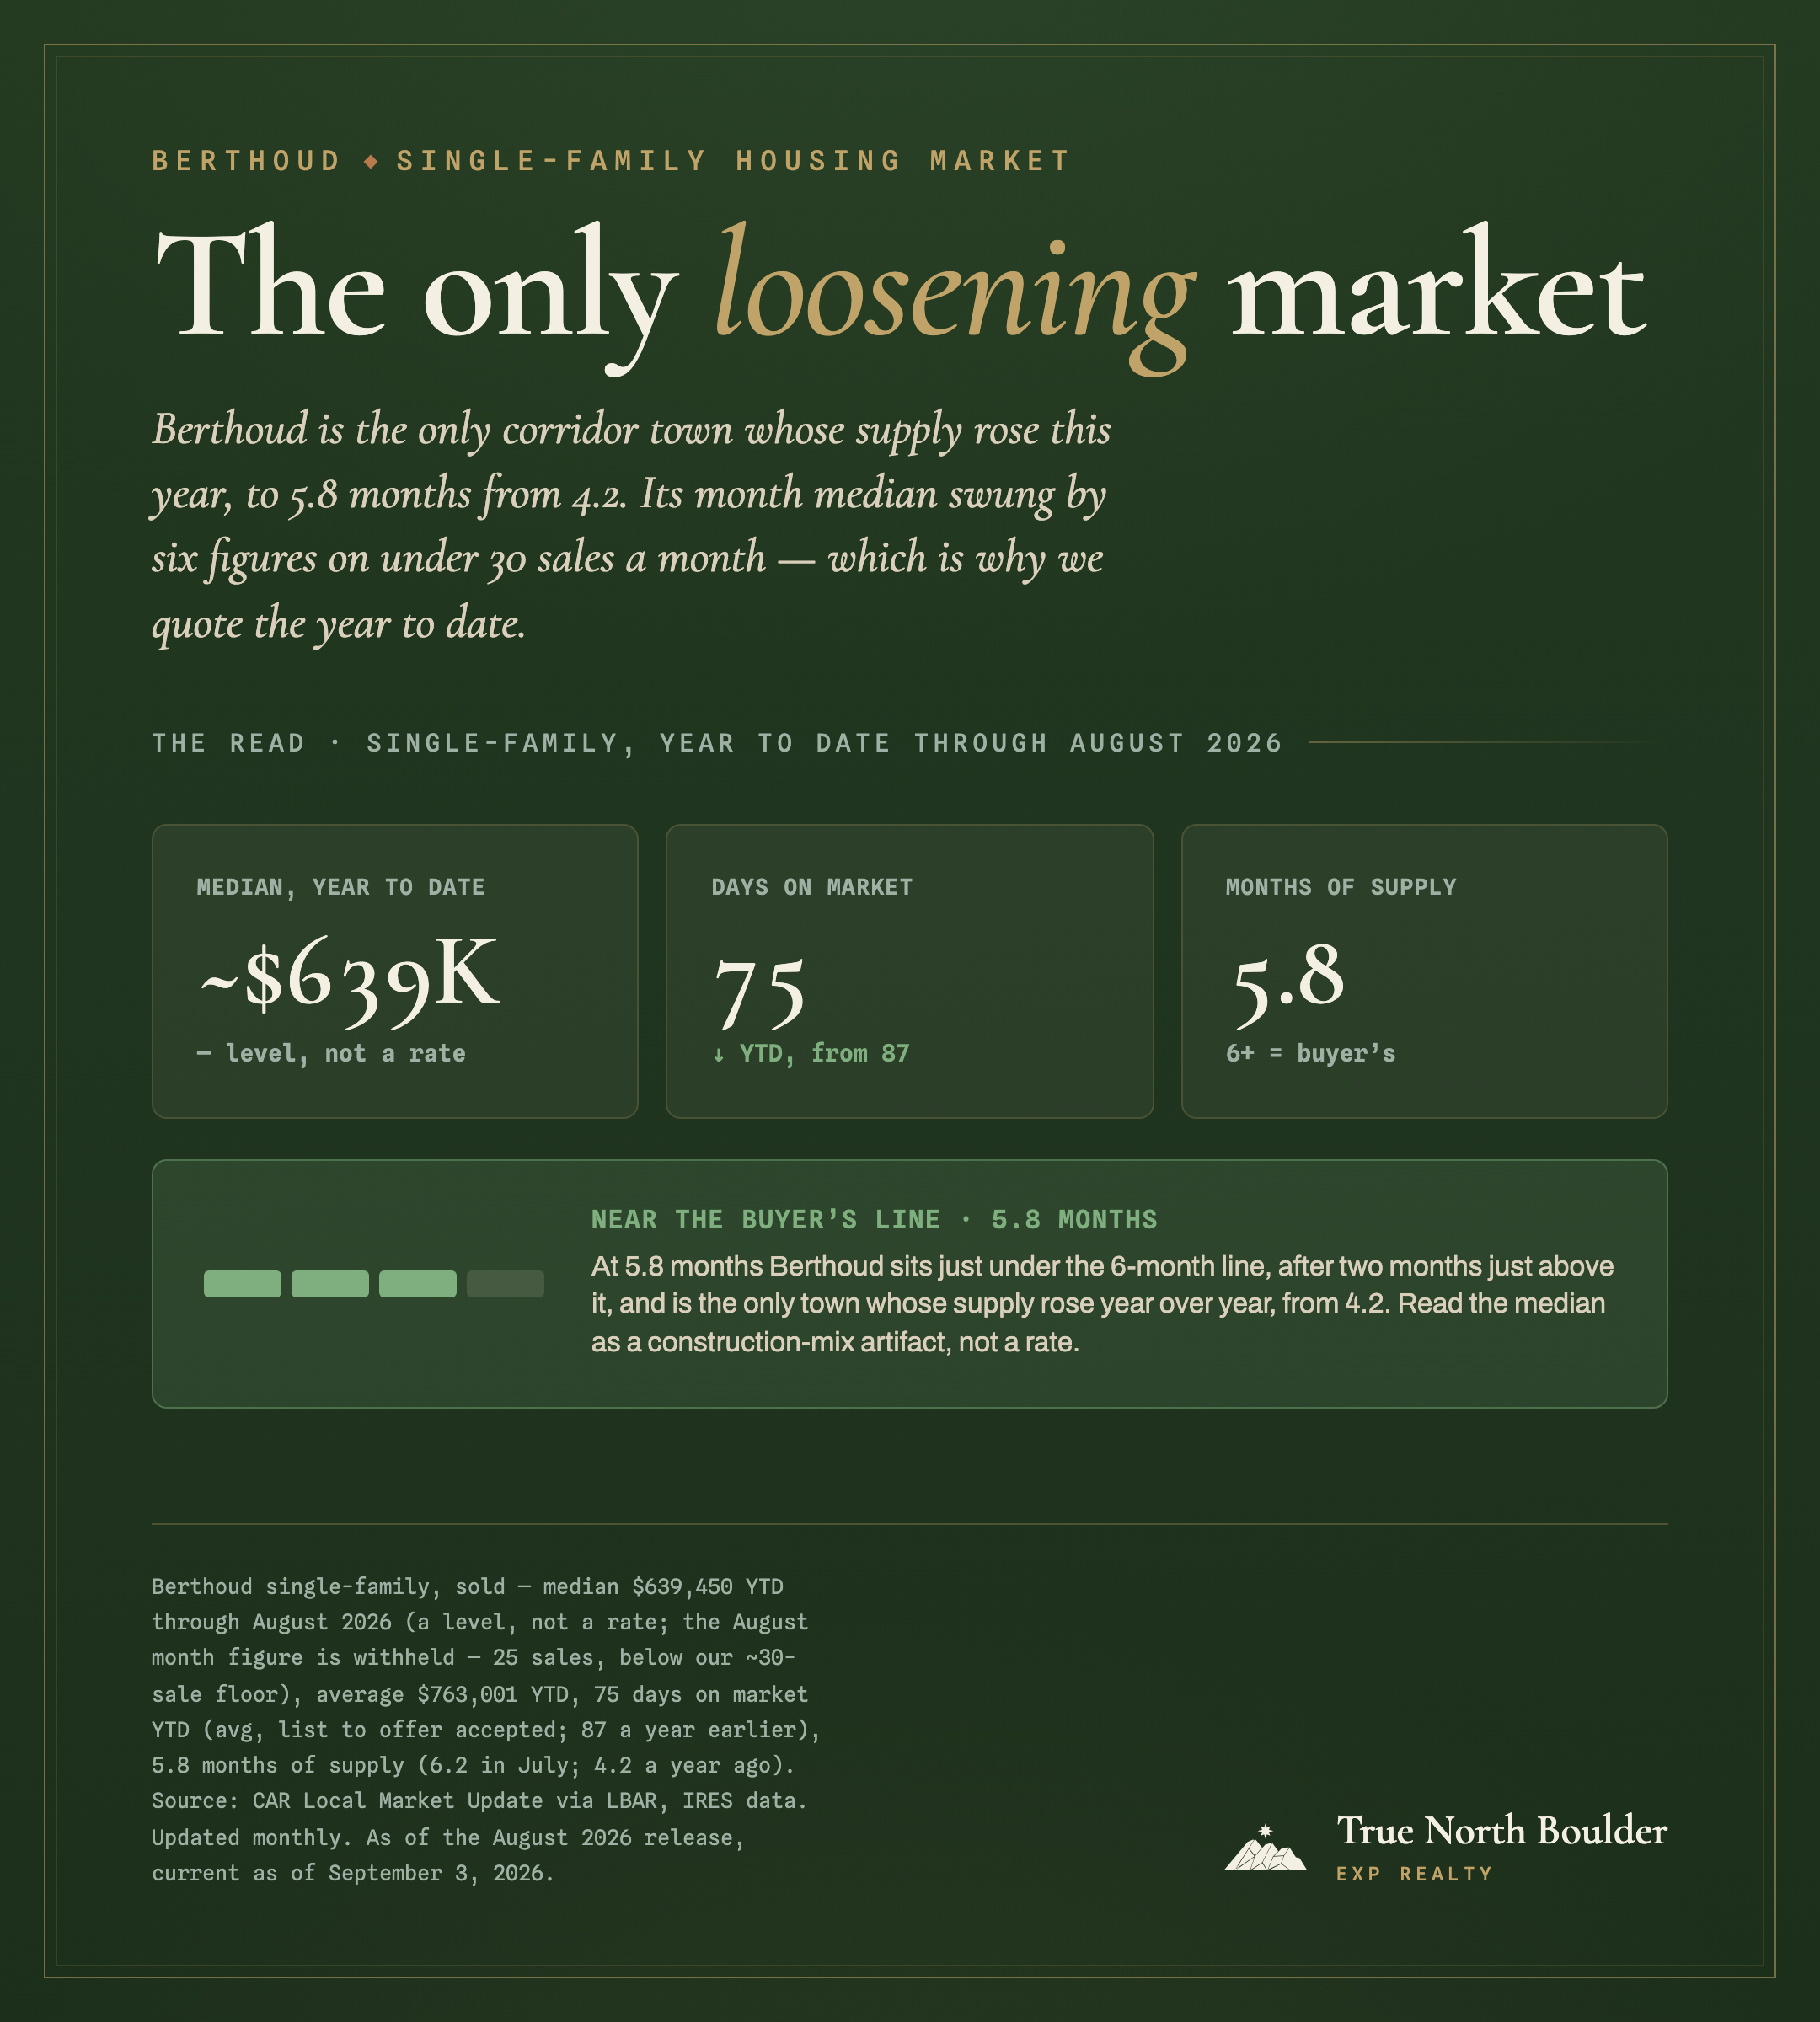
Read those figures the way we compile them: single-family, sold, town of Berthoud, and note why we won't turn that median into a rate.
Two numbers we won't publish for Berthoud
Every figure here is single-family, sold, for the town of Berthoud, from the Colorado Association of REALTORS Local Market Update, built on IRES MLS data and published free each month. Medians, averages and percent-of-list all exclude seller concessions.
First, no Berthoud appreciation rate, and no month median either. Twenty-five single-family homes sold in August, below the roughly 30-sale floor we hold for quoting a monthly level, in a stock that is roughly half new construction. The median tracks the construction mix, not value: the month figure printed $722,500 in June, $590,000 in July and $650,000 in August, while the year-to-date line moved by no more than $10,000. We publish the year-to-date level (mid-$600Ks) and point you to the FHFA repeat-sales index for a real value read. Second, no months-of-supply figure for the $800K–$1.2M band. The move-up product here is new construction that trades well above the $639,450 year-to-date median, in the upper tail of the distribution, which behaves differently from the town aggregate. Both take a direct IRES pull; ask us to run yours.
Is Berthoud a buyer's or a seller's market?
Close to a buyer's market, and the only town moving that way. Berthoud single-family supply sits at 5.8 months, up from 4.2 a year ago. On the scale behind the CAR reports, which ShowingTime produces, the buyers' side starts above six months and a balanced market runs from four to six. Berthoud sat just above six in June and July and just under it in August, on the buyers' edge of balanced. The level matters less than the direction, which is the real story: it loosened over the year while Boulder, Longmont and Loveland all tightened.
| Single-family | Berthoud | Loveland | Longmont | Boulder |
|---|---|---|---|---|
| Median, year to date through August 2026 | ~$639,450 | $528,750 | $610,000 | $1,299,900 |
| Months of supply, August 2026 (a year earlier) | 5.8 (4.2) | 3.0 (3.9) | 2.8 (3.5) | 4.2 (5.4) |
| Direction | looser | tighter | tighter | tighter |
| Days on market, year to date | 75 | 70 | 57 | 72 |
Colorado Association of REALTORS Local Market Updates, data from IRES, single-family, sold, August 2026 and year to date through August 2026. Town-level figures, not band-level. Medians shown year to date, because Berthoud sold only 25 homes in the month; the Berthoud figure is a level, not a rate (see the data note). Longmont and Loveland are within 0.3 months of each other on supply: one cluster, not a ranking.
For a prepared buyer, that leverage is real. In a 5.8-month market with builders carrying standing inventory, you can push on price, on a rate buydown, on closing credits and upgrades, everything except the one cost you can't negotiate, which is the metro-district debt mill (below). If you must sell your current home to buy, though, solve that timing first: even here, a contingent offer is weaker than a clean one. The buy-before-you-sell playbook and bridge loan vs. sale contingency walk the options.
The tax the price doesn't show: the metro-district mill
Most new Berthoud communities are financed through a metropolitan district, which repays its infrastructure bonds with a debt mill levy on your property tax, on top of the county, school, town, fire, and library mills every home pays. In the district serving Heron Lakes and TPC Colorado it runs on the order of 80 mills, close to as much again as every other taxing authority combined, and it doesn't appear in a home's price or a town median. It's also the one number in a new-build deal nobody can negotiate. Read the service plan and check the parcel with the Larimer County Assessor; the Berthoud market and neighborhood hub explains the mechanics.
The honest take
Berthoud is the corridor town where the numbers most reward a careful buyer and most punish a lazy one. The good news is real: it is the only town in the footprint that loosened over the past year, sitting close to the six-month buyer's-market line, and a prepared buyer has leverage here that Longmont and Loveland buyers have lost. The trap is equally real. The Berthoud median is a construction-mix number, not a value, so pricing off it, up or down, is guessing; and the move-up product is new construction that carries a metro-district debt mill the sticker never shows. So use the leverage, refuse the median, and price the mill for the specific lot before you fall for the model home. That's the whole Berthoud game.
We won't publish a band number or a fake appreciation rate. We will build your comp set.
A hand-built comp set at your price and product, plus the metro-district mill for the specific parcel. That's the honest answer to what a Berthoud home is worth to own.
Frequently asked
What is the median home price in Berthoud?+
Use the year-to-date figure: $639,450 through August 2026, in the mid-$600Ks, with a much higher average near $763,001 (Colorado Association of REALTORS Local Market Update, data from IRES). A month median isn't a usable level here: only 25 single-family homes sold in August, below the roughly 30-sale floor at which we will quote a monthly level at all, and the month figure has read $722,500 in June, $590,000 in July and $650,000 in August on samples that thin. We publish the level, not a year-over-year change, on purpose: Berthoud is a small, build-heavy market, so the median tracks which new homes happened to close, not whether values rose or fell. The move-up band trades above the median, in new-construction communities.
Why won't you give a Berthoud price appreciation rate?+
Because it would be noise dressed as a number, and the last three releases prove it. In a town where roughly half the housing stock is new construction and only a few dozen homes sell a month, the median moves on the construction mix: the month median printed $722,500 in June 2026, $590,000 in July and $650,000 in August, on 25 to 28 sales each, while the year-to-date line went from $645,000 to $635,000 to $639,450. Nothing about the town changed in between. The gap between Berthoud's year-to-date median ($639,450) and its average ($763,001) is that same new-build skew in a single figure. For a real read on value, use a repeat-sales index like the FHFA House Price Index, never a small-town median.
Is Berthoud a buyer's or a seller's market?+
Close to a buyer's market, and the only town moving that way. Berthoud single-family carries 5.8 months of supply in August 2026 and is the only town in the footprint that loosened over the past year, from 4.2 (CAR/IRES). ShowingTime, the company behind the CAR town reports, calls four to six months generally balanced and treats supply past six months as favoring buyers, so at 5.8 Berthoud sits at the top of the balanced range, just under the six-month line, after two months above it (6.3 in June, 6.2 in July), while Boulder runs 4.2 and Longmont and Loveland run 2.8 and 3.0. Homes took 75 days on average to go under contract year to date, faster than the 87 of a year ago; the August figure, 71 days, rests on the same thin 25-sale month. A prepared buyer holds real leverage here.
What is a metro district and does it affect my Berthoud taxes?+
Most new Berthoud communities are financed through a metropolitan district, which repays its infrastructure bonds with a debt mill levy on your property tax, on top of the county, school, town, fire, and library mills. It can materially raise the total rate and runs for decades, and it doesn't show up in a home's price or a town median. Read the service plan and check the parcel with the Larimer County Assessor before you buy; the Berthoud market and neighborhood hub explains the mechanics.
How often is this report updated?+
Monthly, at this same URL, with a refreshed last-updated date. The figures come from the Colorado Association of REALTORS Local Market Update for Berthoud, built on IRES MLS data and published roughly four weeks after month end.
Sources & data notes
- All Berthoud, Loveland, Longmont and Boulder figures: Colorado Association of REALTORS Local Market Update, single-family, sold, August 2026 (and year to date through August), stamped current as of September 3, 2026, published free each month by the Loveland-Berthoud Association of REALTORS, built on IRES MLS data. Berthoud · Loveland · Longmont · Boulder. Berthoud: median $639,450 YTD (the August month figure is withheld as a level: 25 sales, below our ~30-sale floor); average $763,001 YTD; 75 days YTD (87 a year earlier); 5.8 months of supply (6.2 in July, 4.2 a year ago); 220 sales year to date; 98.6% of last list price YTD; inventory 149.
- Why no year-over-year on the Berthoud median, and why no month figure. At 25 single-family sales in August (26 in July), below the ~30-sale floor, in a roughly half-new-construction stock, the median tracks construction mix, not value; the month figure printed $722,500 in June, $590,000 in July and $650,000 in August, while the year-to-date line went from $645,000 to $635,000 to $639,450. We publish the year-to-date level and use a repeat-sales index for value, the FHFA House Price Index (the Fort Collins-Loveland metro covers the Larimer County part of town; the Weld County part falls in the Greeley metro). The median-to-average gap ($639K vs $763K year to date) is the new-build skew.
- Basis matters. These are single-family figures; Berthoud townhome/condo is a separate, very thin market. Medians, averages, and percent-of-list exclude seller concessions. "Percent of list price received" (98.6% year to date) is against the last list price, after reductions, not the original.
- Months of supply is inventory divided by trailing-twelve-month average pending sales (ShowingTime, which produces the report). Its reading: past 6.0 the market favors buyers, below 4.0 sellers, and a balanced market "will lie somewhere between four and six months of supply." Berthoud at 5.8 sits just under the six-month line, after 6.3 in June and 6.2 in July, and is the only town in the footprint whose supply rose year over year.
- Metro-district debt mill: new Berthoud communities are financed through metropolitan districts whose debt levy is charged on top of the base mills; in the Berthoud-Heritage district (Heron Lakes / TPC Colorado) it runs on the order of 80 mills for 2026 collection (Berthoud-Heritage Metropolitan District No. 6 adopted 2026 budget, about 82.7 mills; the full breakdown is in the Berthoud hub). Verify the specific district and service plan per parcel with the Larimer County Assessor. See the Berthoud hub.
- What we do not publish: a Berthoud appreciation rate, or a months-of-supply/median figure for the $800K–$1.2M band. Both require a direct IRES broker pull, so we leave that figure blank rather than manufacture one.
Get the monthly Berthoud read.
Real MLS numbers, the basis they're measured on, and what we won't publish and why, about once a month. Unsubscribe any time; see our privacy policy.
See also: the Berthoud market and neighborhood hub · the buy-before-you-sell playbook · bridge loan vs. sale contingency · what a move-up budget buys across the corridor. External: CAR Local Market Update, Berthoud (IRES data) · Larimer County Assessor.
Daniel Hsieh is a licensed Colorado real estate broker with True North Boulder, brokered by eXp Realty. Market figures are month-old MLS data and are not a valuation of any specific home; verify any number against current IRES or county data before acting. This report is general market information, not lending, tax, or legal advice; confirm your specifics with your lender, CPA, or attorney.